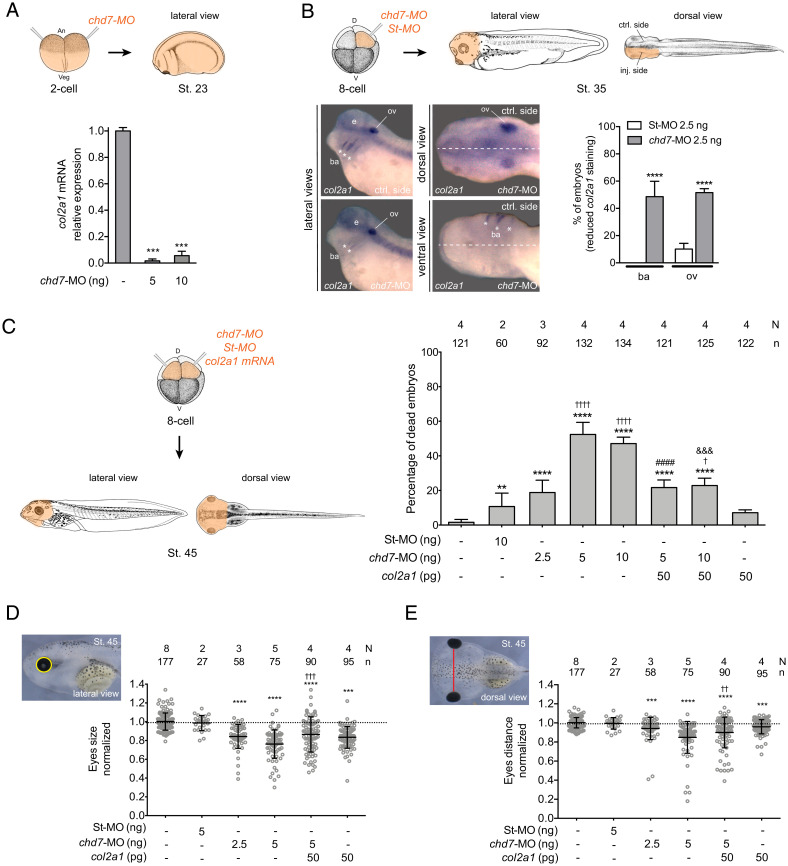
Fig. 5.
Expression of col2a1 rescues Chd-7 knockdown in Xenopus embryos. (A) Expression levels of col2a1 mRNA are reduced in chd7-MO–injected embryos. Both blastomeres of two-cell–staged embryos were injected with 5 or 10 ng of chd7-MO and processed for RNA extraction at stage 23 (St. 23) (schematic above). Error bars indicate SE from two repeats of the PCR with different biological samples. One-tailed paired t test, ***P < 0.001. (B) col2a1 expression domain is altered in the branchial arches (ba) and otic vesicle (ov) of Chd7-depleted embryos. In situ hybridization of stage 35 embryos for col2a1. One D1 blastomere of eight-cell–staged embryos was injected with 2.5 ng of St-MO or chd7-MO (schematic above) (N = 2; 42 and n = 3; 71, respectively) (N = number of experiments; n = number of embryos). Lateral, dorsal, and ventral views, anterior to the left. e: eye. Lateral views: Upper and Lower are control (ctrl) and chd7-MO injected sides of the same representative injected embryo, respectively. Dorsal and ventral views: white dashed lines show the middle line of the embryo. Comparisons were done between the injected side and the contralateral control side of the same embryo (schematic above). The graph is a quantification of the results. Reduced col2a1 staining was observed in 18% of St-MO and 77% of chd7-MO–injected embryos that survived through stage 35. Data on graph is presented as means with SE. Fisher’s exact test (****P < 0.0001). Asterisks represent comparison to St-MO group. (C) Lethality in Chd7-depleted embryos is rescued by overexpression of col2a1. Graph showing the percentage of dead embryos by stage 45. Both D1 blastomeres of eight-cell–staged embryos were injected as indicated in the graph and scored for survival at stage 45 (schematically depicted above). Data on graph is presented as means with SE. Fisher’s exact test (†P < 0.05, **P < 0.01, &&&P < 0.001, ****,††††,####P < 0.0001). Asterisks represent comparison to uninjected group; daggers represent comparison to St-MO group; pound and ampersands represent comparison to chd7-MO 5 ng and 10 ng, respectively. (D and E) Craniofacial morphometric analysis of Xenopus tadpoles at stage 45. Embryos were injected as indicated in C. Each dot represents a single embryo. Means and SD are indicated. One-way ANOVA and Tukey’s multiple comparisons test. (D) Quantification of the eye size (Upper Left). ***,†††P < 0.001, ****P < 0.0001. (E) Quantification of the eye distances (Upper Left). ††P < 0.01, ***P < 0.001, ****P < 0.0001. Lateral views, anterior to the left. Asterisks represent comparison to uninjected group and daggers represent comparison to chd7-MO 5-ng injected group. N = number of experiments, n = number of embryos. The source of Xenopus stage illustrations in A–C is Xenbase (https://www.xenbase.org/entry/, RRID:SCR_003280). Xenopus illustrations ©: Natalya Zahn (90) and by Nieuwkoop and Faber (86). The 12.5x and 20X digital magnification zoom of Leica L2 stereoscope were used for images in B. The 12.5x digital magnification was used for images in D and E.

