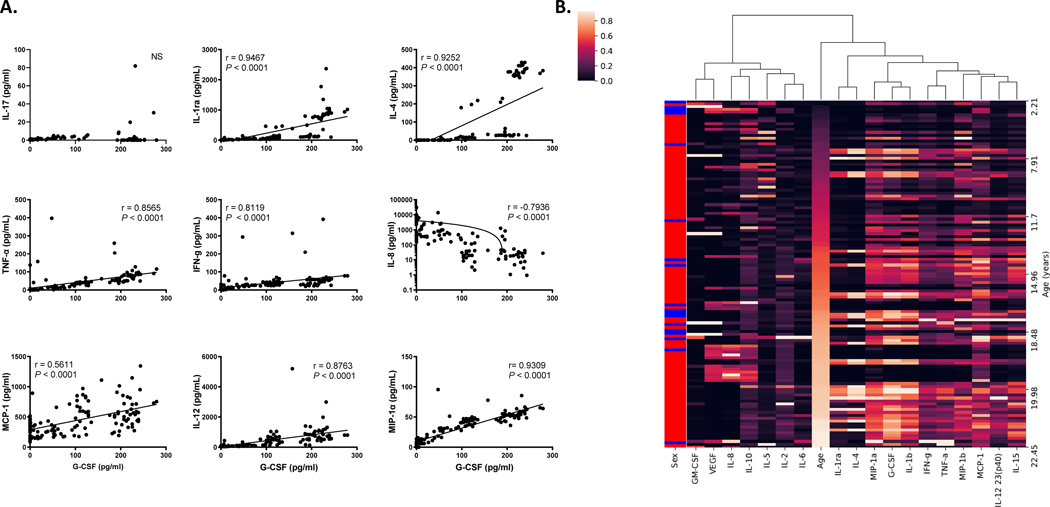
FIGURE 4. Cytokines that directly correlated with G-CSF levels in rhesus macaques aged 2 – 24 years old.
(A) Spearman nonparametric correlations and pairwise scatter plots between G-CSF and representative examples of cytokines are shown. Note the levels for IL-8 were plotted on a log scale. P < 0.05 was considered significant. NS, not significant. (B) Hierarchical clustering analysis of 18 plasma cytokines levels in 123 rhesus macaques that were sorted by age. (i.e. young to old: dark to light, Sex; red = female and blue = male)

