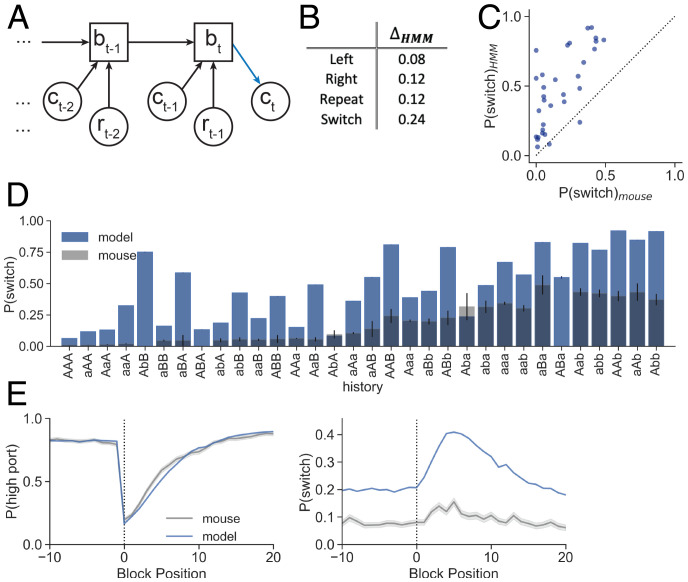
Fig. 3.
HMM overestimates mouse switching probability. (A) The HMM recursively updates belief state (bt) by incorporating evidence from choice () and reward () of the recent trial. The next choice (ct) depends on the model posterior and the policy (blue). (B) Absolute values of the differences between the HMM confusion matrices and nonparametric confusion matrix (Fig. 2E) for each action type. (C) Conditional switch probabilities generated from the HMM plotted against those observed from mice (sum of squared error [SSE] = 4.102). (D) Conditional switch probabilities as predicted by the HMM (blue; model) overlaid on the observed mouse behavior (gray) for all history sequences of length 3. Sequences on the x axis are sorted according to mouse conditional switch probabilities of the full dataset (Fig. 2D). The bar heights show the mean switch probability across mice for each corresponding sequence history, and the error bars show the binomial SE for the mouse test data. (E) HMM-generated (blue; Left) and (Right) as a function of trial number surrounding state transition (block position 0) as compared to the mouse behavior (gray). Dark lines show the mean across trials at the same block position, and the shading shows the SE.

