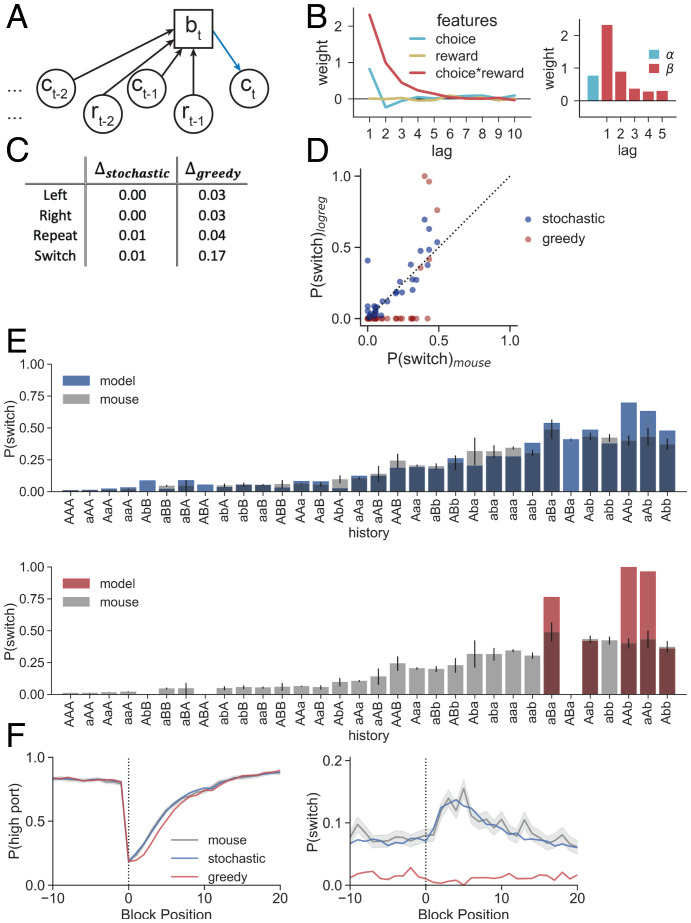
Fig. 4.
Stochastic logistic regression policy captures mouse behavior comprehensively, whereas greedy logistic regression fails to predict switches. (A) The logistic regression computes the probability of choice (bt) from choice () and reward () information across a series of trials. Here we represent the model estimate as bt for consistency across graphical representations, but note that it in this case it corresponds to the log-odds of choice, ψ (Eqs. 1 and 2). (B) (Left) Feature weights for a logistic regression predicting the log-odds of mouse port selection for the choices, rewards, and choice–reward interactions in the previous 10 trials. (Right) Feature weights after cross-validation for hyperparameters and refitting the model. α is the weight on the previous choice, and β is the set of weights on choice–reward information for the previous five trials. (C) Absolute value of the differences between the logistic regression confusion matrices and nonparametric confusion matrix (Fig. 2E) for each action. Δ scores are shown for stochastic logistic regression as well as for greedy logistic regression. (D) Conditional switch probabilities generated by the logistic regression model using a stochastic (blue) or greedy (red) policy plotted against those observed in mice (stochastic SSE = 0.378, greedy SSE = 1.548). (E) (Top) Conditional switch probabilities for the stochastic logistic regression (blue) across sequences of history length 3 overlaid on those from the mouse data (gray). Sequences on the x axis are sorted according to mouse conditional switch probabilities of the full dataset (Fig. 2D). Error bars show binomial SEs for the mouse. (Bottom) As in Top but for a greedy policy (red). (F) (Left) and (Right) as a function of trial number surrounding state transition (block position 0). Logistic regression predictions with a stochastic (blue) and greedy (red) policy are overlaid on probabilities observed for mice (gray). Dark lines show the mean across trials at the same block position, and the shading shows the SE.

