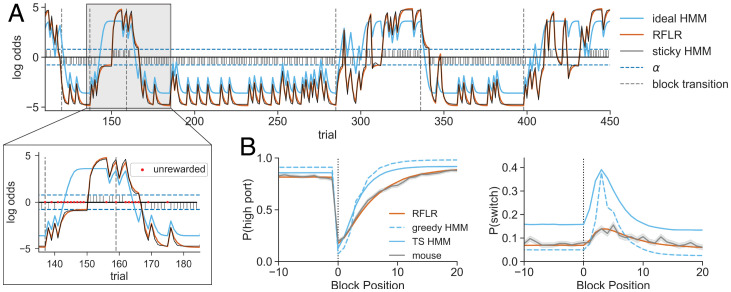
Fig. 6.
Simulations with a generative RFLR recapitulate mouse behavior. (A) Representative session depicting equivalent trial-by-trial log-odds computations for the RFLR vs. the sticky HMM (orange vs. black traces). These model estimates contrast the log-odds of the posterior computed by the ideal HMM (light blue), which specifically diverges in prediction updating following unrewarded trials. Stem plot shows the choice–reward interaction that provides action–outcome evidence to the RFLR. Horizontal dashed lines indicate , and vertical dashed lines indicate state transitions. Zoomed-in image shows an expanded segment of the session with unrewarded trials labeled by red dots. (B) (Left) and (Right) as a function of trial number surrounding a state transition (block position 0) in the 80–20 condition for the generative RFLR (orange), generative ideal HMM (light blue, dashed), and Thompson sampling HMM (TS, solid) overlaid with the observed mouse probabilities (gray). The lines show the means across trials at the same block position, and the shadings show the SEs.

