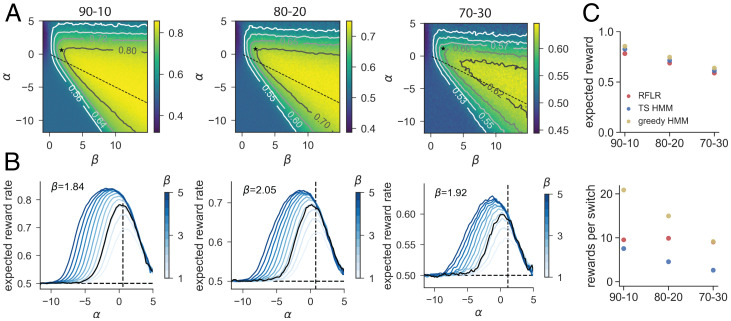
Fig. 7.
Reward per switch ratios differentiate models and policies that all achieve near-maximal expected reward. (A) Expected reward landscape for the generative RFLR across varying α (y axis) and β (x axis) values with the empirically observed τ in each of the three reward conditions (, and ). Color bars indicate expected reward rate across simulated trials, and isoclines mark increments above random (0.5). The RFLR-fit α and β values are depicted with the asterisk, and the relative α and β specified for the HMM lie along the dashed line. (B) Profile of expected reward as a function of α for varying values of β (color bar, ranging from β = 1 to β = 5, with fit β in black). Expected reward rate at the fit α (black vertical dashed line) suggests minimal additional benefit of modulating β. (C) (Top) Expected reward in each of the three probability contexts for the generative RFLR using mouse-fit parameters and generative HMM using the true task parameters. HMM performance is shown using either a greedy or stochastic (Thompson sampling, TS) policy. (Bottom) Ratio of rewards to switches for each of the three models across reward probability conditions. Each data point shows the mean across simulated sessions, and error bars show SE but are smaller than the symbol size.

