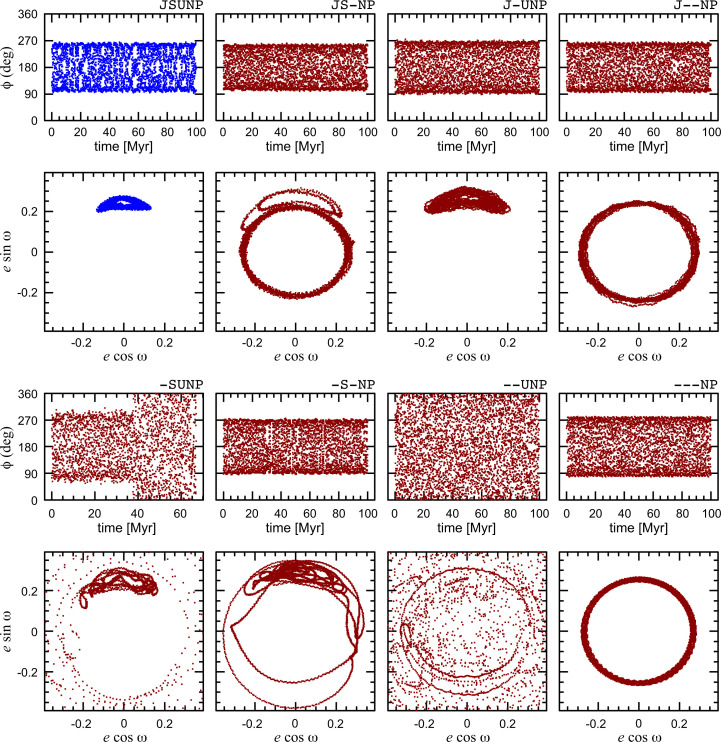
Fig. 2.
The evolution over 100 My of Pluto’s critical resonant angle (Eq. 1), and argument of perihelion ω, in numerical simulations with different sets of perturbers. Blue is for the highest-fidelity model including all four giant planets and Pluto (JSUNP); the other cases are shown in dark red, with the planets in the model indicated in the legend above each pair of panels (for example, –UNP indicates the model with Uranus, Neptune, and Pluto). Note that, in the case of model -SUNP, the simulation lasts only about 67 My, ending because Pluto traveled too far from the Sun (heliocentric distance r > 100 au) on a very extended orbit no longer confined to Neptune’s 3/2 mean motion resonance. The output interval in the plots is 25 Ky.

