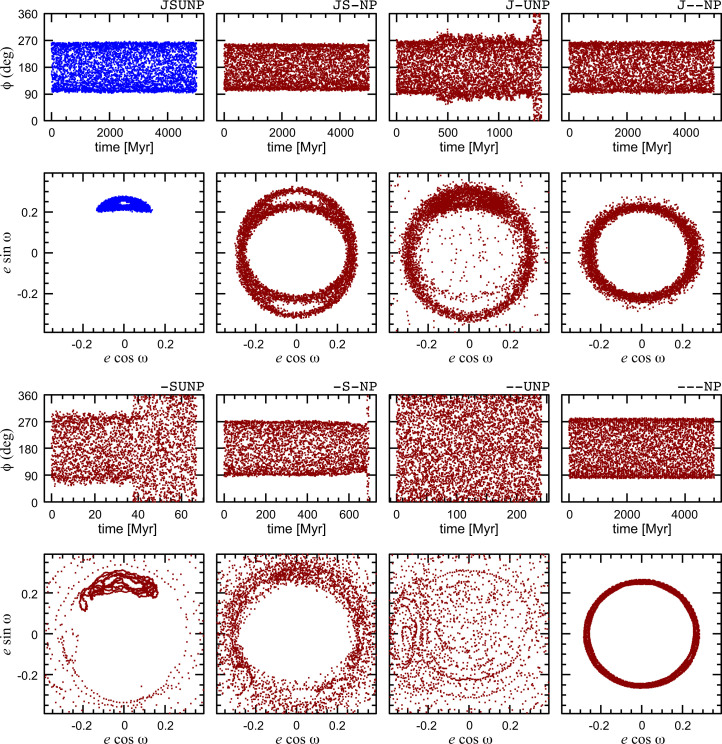
Fig. 3.
Similar to Fig. 2, but for the evolution up to 5 Gy. The output interval in the plots is 1 My for those models in which Pluto’s stability time is at least 5 Gy; for the cases with shorter stability times, the output interval is shorter, in the range 20 Ky to 250 Ky.

