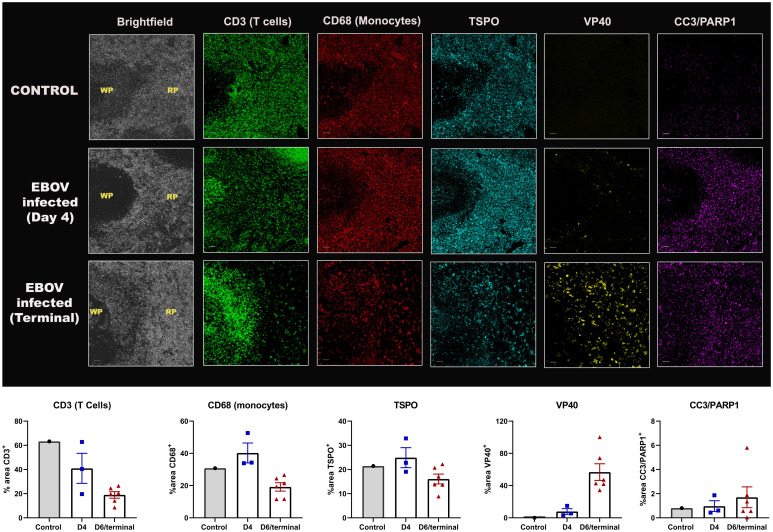
Fig. 5.
Postmortem immunostaining in the spleen. Representative MF-IHC images of a single spleen section from a control (Top), day 4-infected (Middle), and a terminally infected EBOV macaque (Bottom). The various stains are: CD3 (T cells), CD68 (Macrophages), TSPO, CC3/PARP1 (cell death markers), VP40 (EBOV marker). The regions shown here consist of both the red pulp (RP) and white pulp (WP) areas, as indicated in the brightfield images. (Scale bars, 50 μ.) The quantification data measuring percent area of positive staining for control (n = 1), day 4 (n = 3) and terminal animals (n = 6) is shown below each stain and was obtained by drawing multiple regions-of-interest across the entire splenic section using ImageJ.

