
Figure 4.
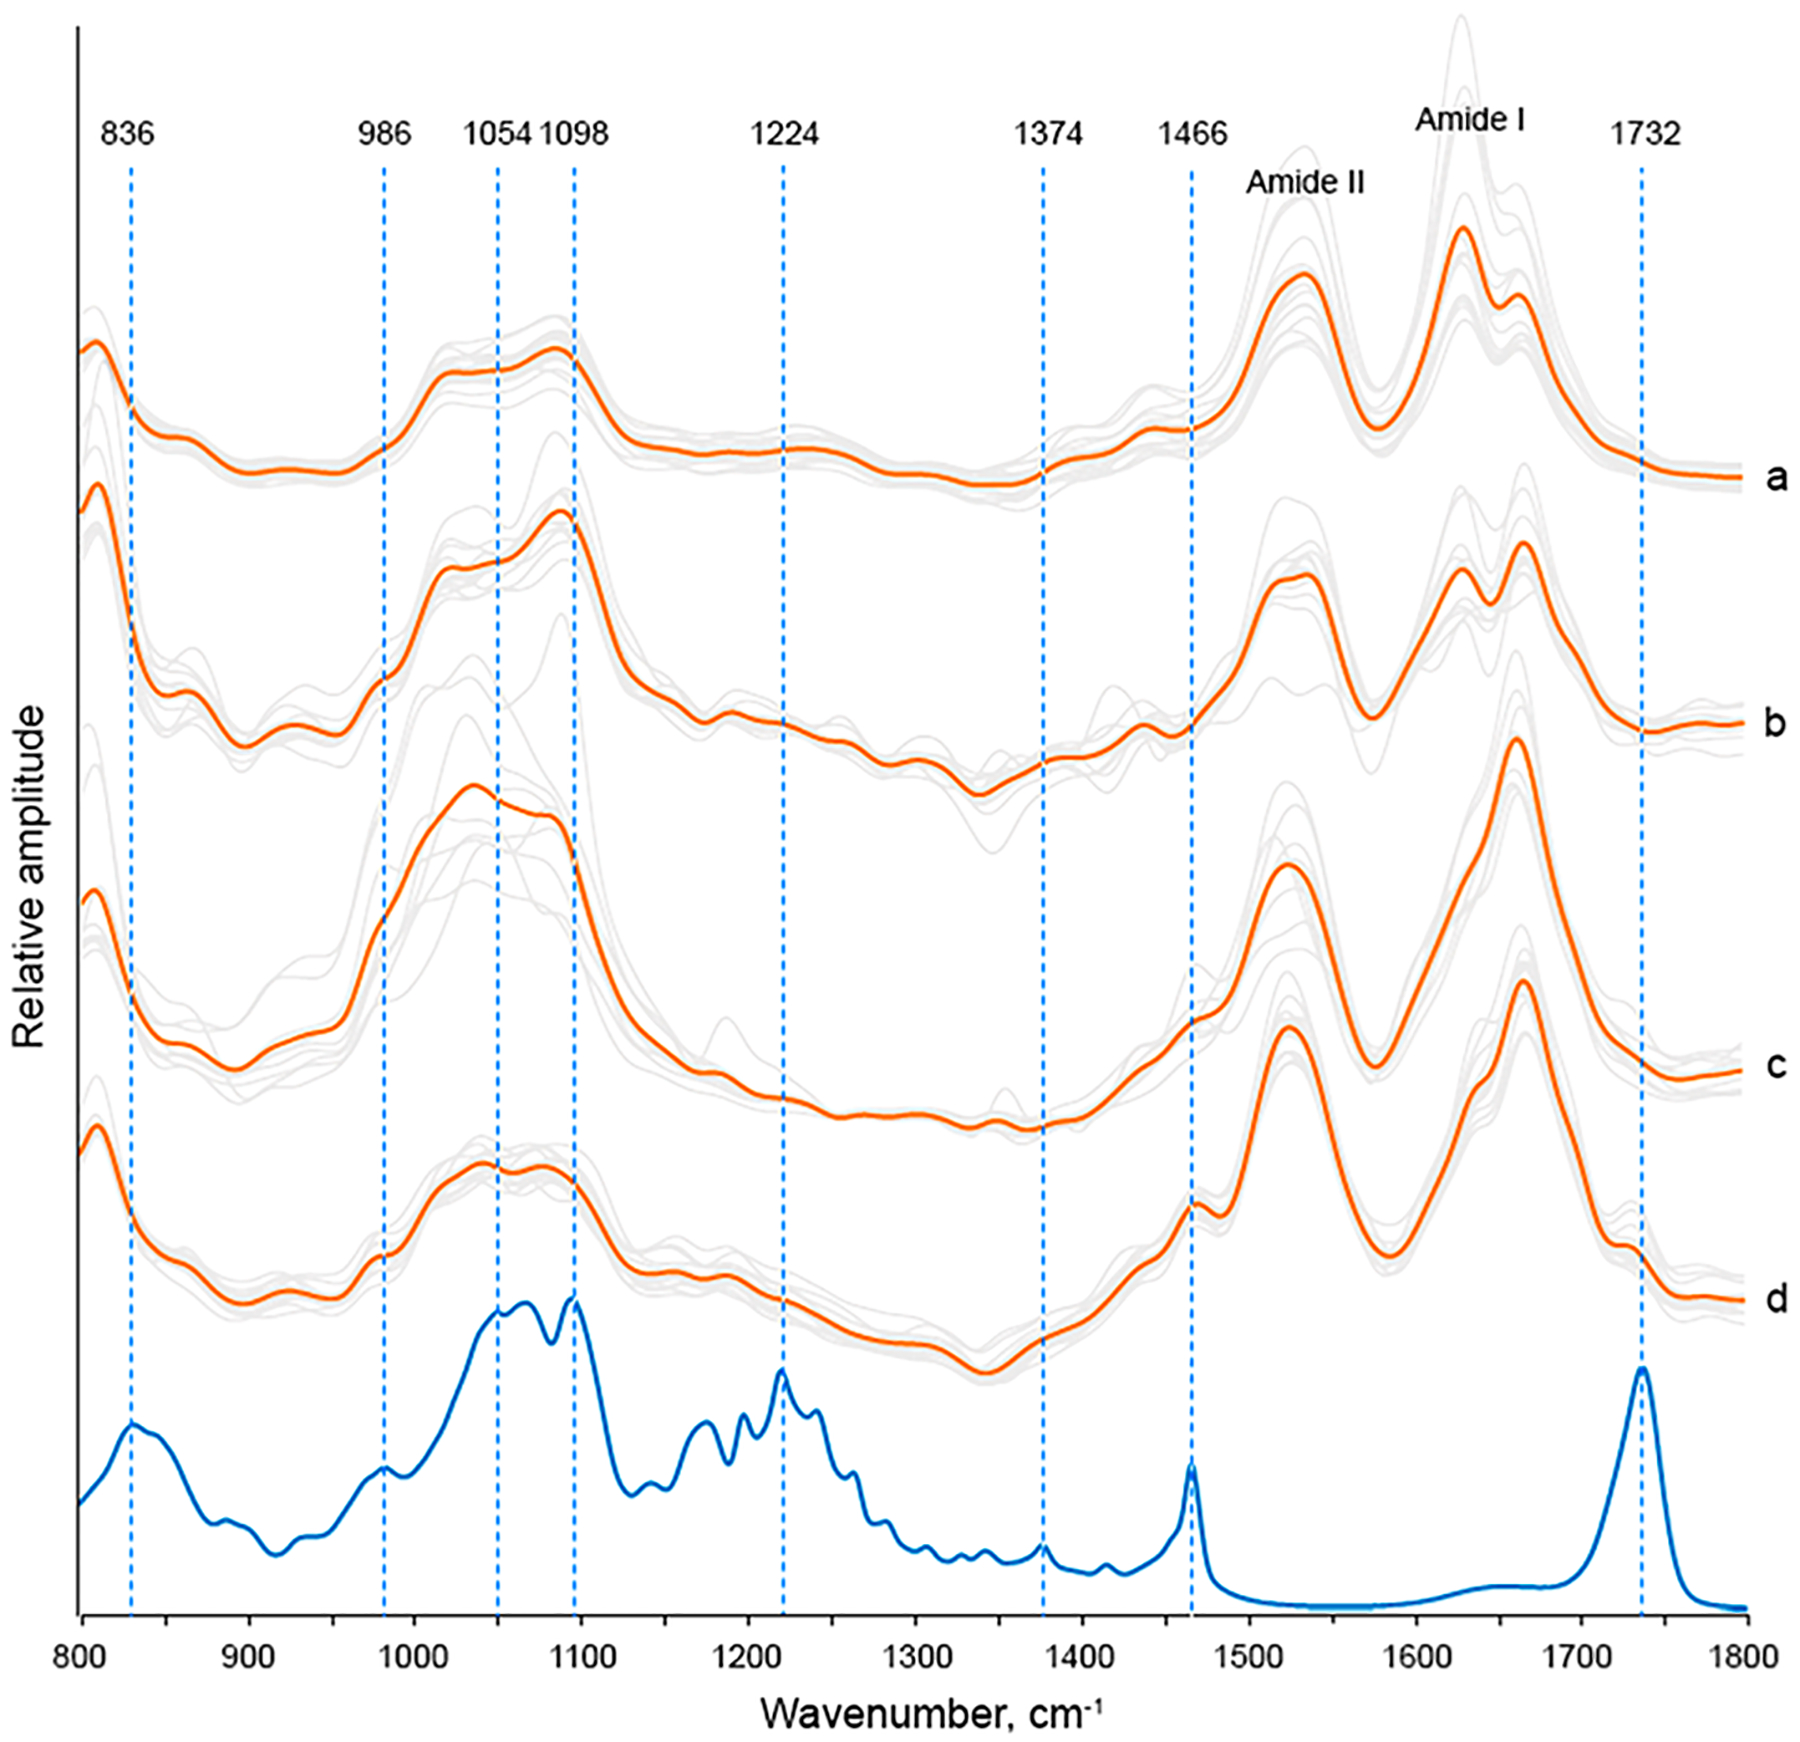
AFM IR spectra of Ins:CL fibrils (a), protofibrils (b), and oligomers (c, d) (gray) with corresponding average spectra shown in orange. FTIR spectrum of CL (blue).
Official websites use .gov
A
.gov website belongs to an official
government organization in the United States.
Secure .gov websites use HTTPS
A lock (
) or https:// means you've safely
connected to the .gov website. Share sensitive
information only on official, secure websites.
AFM IR spectra of Ins:CL fibrils (a), protofibrils (b), and oligomers (c, d) (gray) with corresponding average spectra shown in orange. FTIR spectrum of CL (blue).