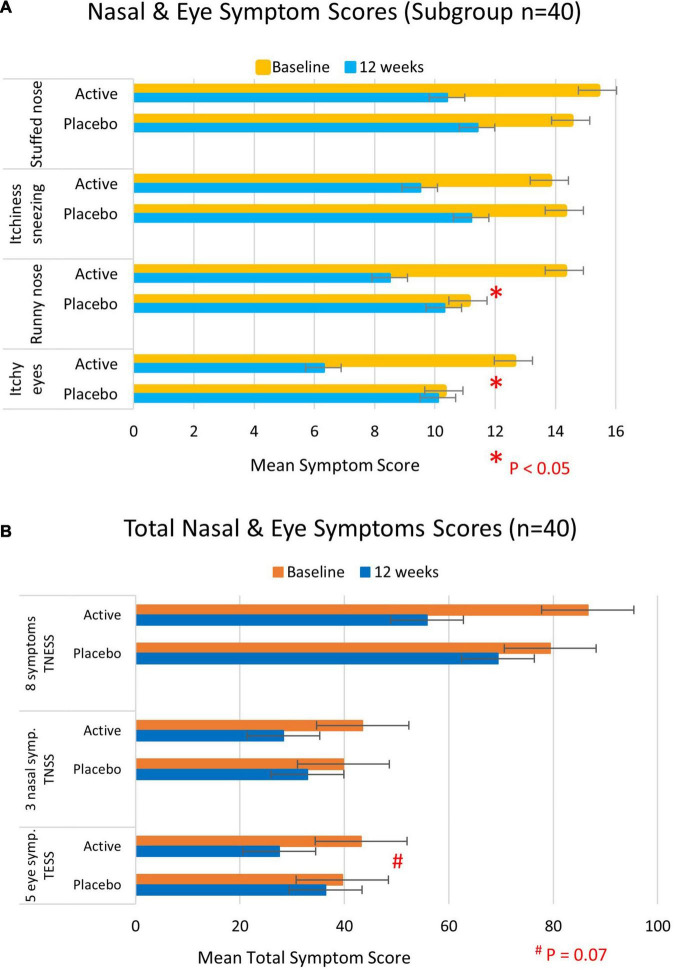
FIGURE 3.
Total nasal and eye symptom scores at baseline (yellow/orange bars) and 12 weeks (blue bars) of participants who took the full course of 10–12 week trial intervention (n = 40). (A) Individual symptom scores and (B) total nasal and/or eye symptom scores. Higher scores represent more severe symptoms.

