FIGURE 3.

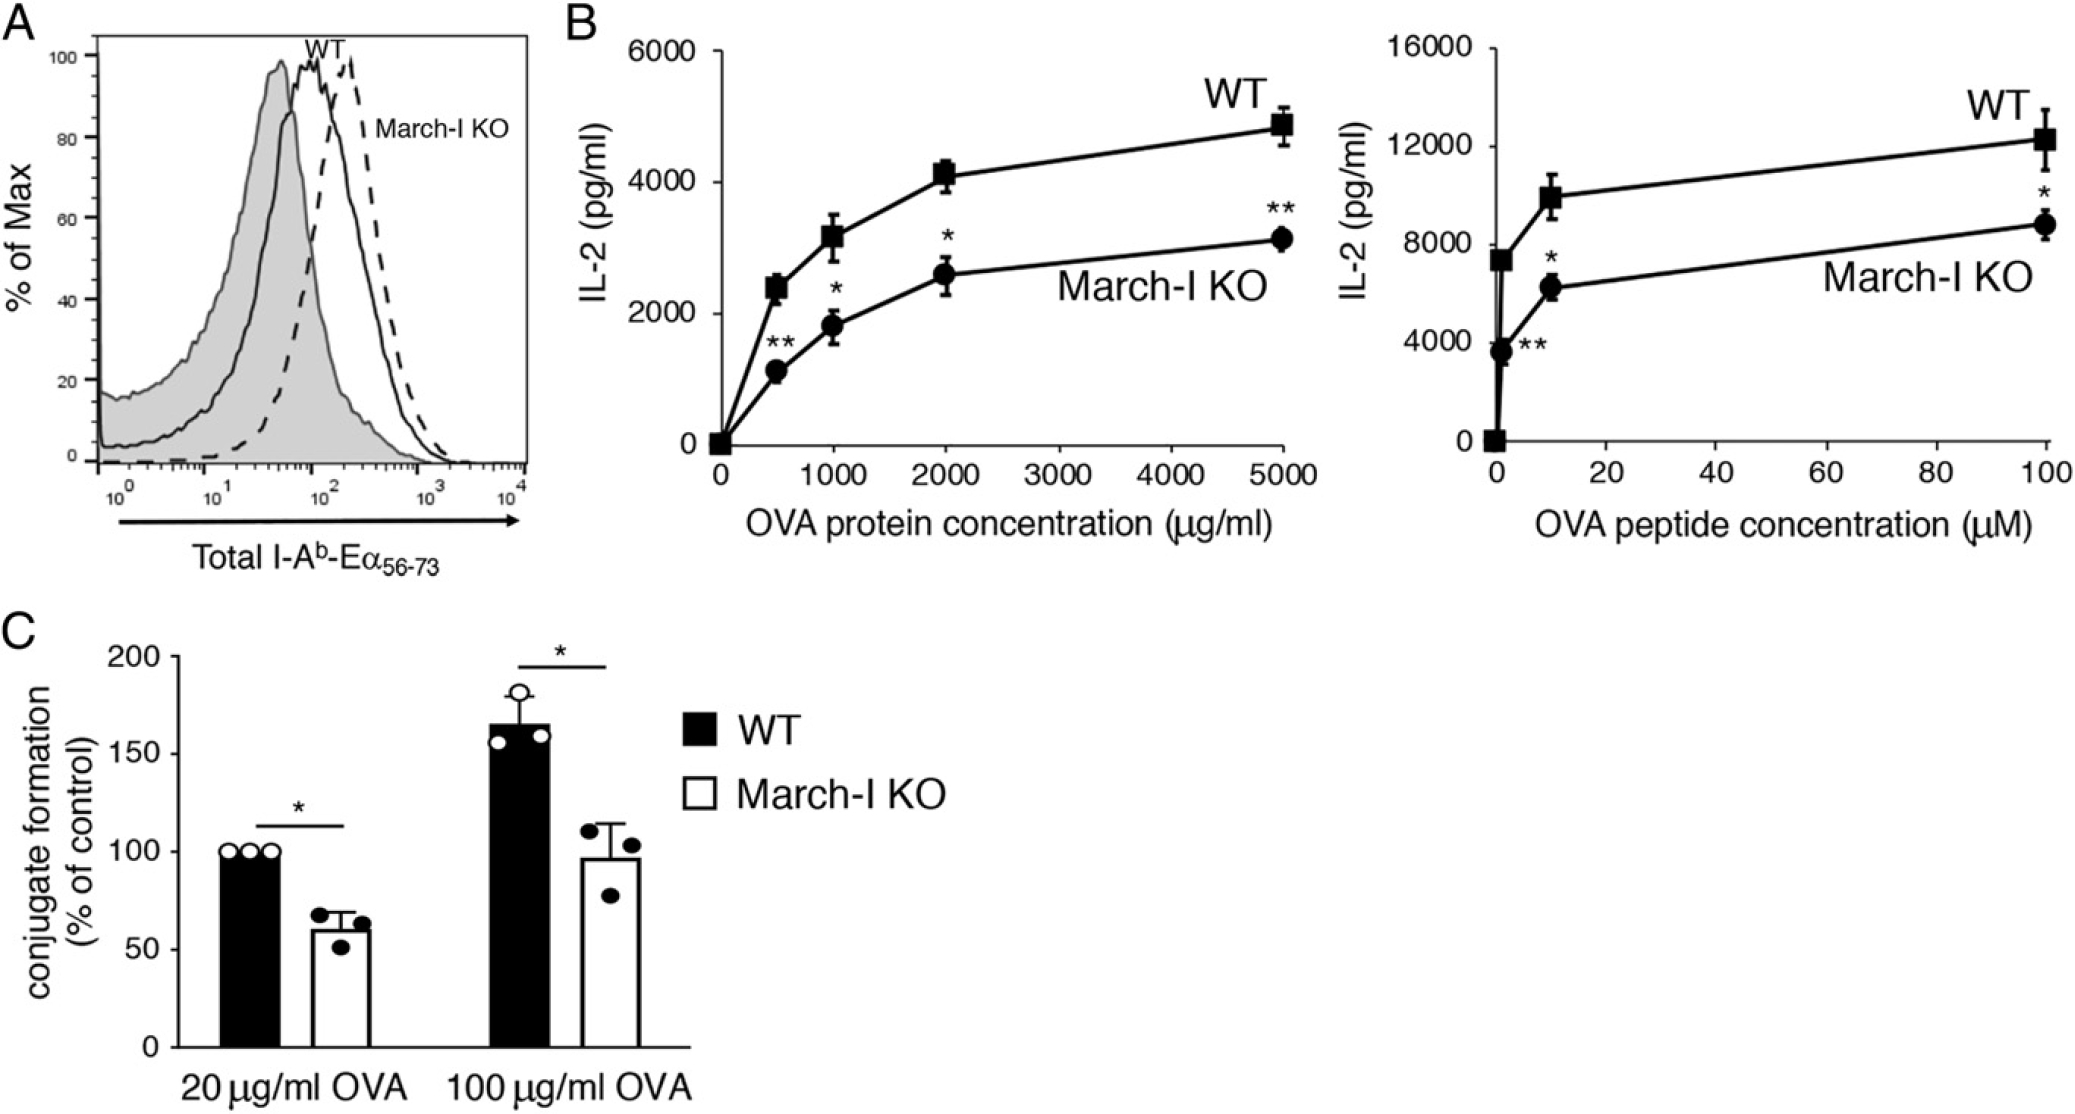
March-I KO spleen DCs make large amounts of pMHC-II but are poor stimulators of Ag-specific CD4 T cells. DCs were isolated by magnetic bead purification from spleen of WT C57BL/6 mice or March-I KO mice on a C57BL/6 background. (A) Purified DCs were incubated with 50 μg/ml of Eα-OVA(56–73) fusion protein for 3 h and surface expression of I-Ab–Eα(56–73) complexes was determined by flow cytometry using the pMHC-II complex–specific mAb YAe. A representative histogram showing staining of WT DCs incubated with no Ag (gray fill) and either WT DCs (black line) or March-I KO DCs (dash line) is shown. (B) Spleen DCs from either WT mice (filled bars) or March-I KO mice (open bars) were cocultured with naive OT-II CD4+ T cells and various amounts of OVA protein or OVA(323–339) peptide. The amount of IL-2 secreted after 24 h of culture was determined by ELISA. (C) CellTracker Deep Red–stained DCs were incubated in the absence of presence of the indicated amount of OVA for 3 h. DCs were then combined with CellTracker Green–stained OT-II CD4+ T cells for 30 min and DC/T cell conjugate formation was analyzed by flow cytometry. The percentage of T cells present in DC/T cell conjugates (relative to that using WT DCs incubated with 20 μg/ml OVA) was determined. The data shown are the mean ± SD obtained from three independent experiments. *p < 0.05, **p < 0.005.
