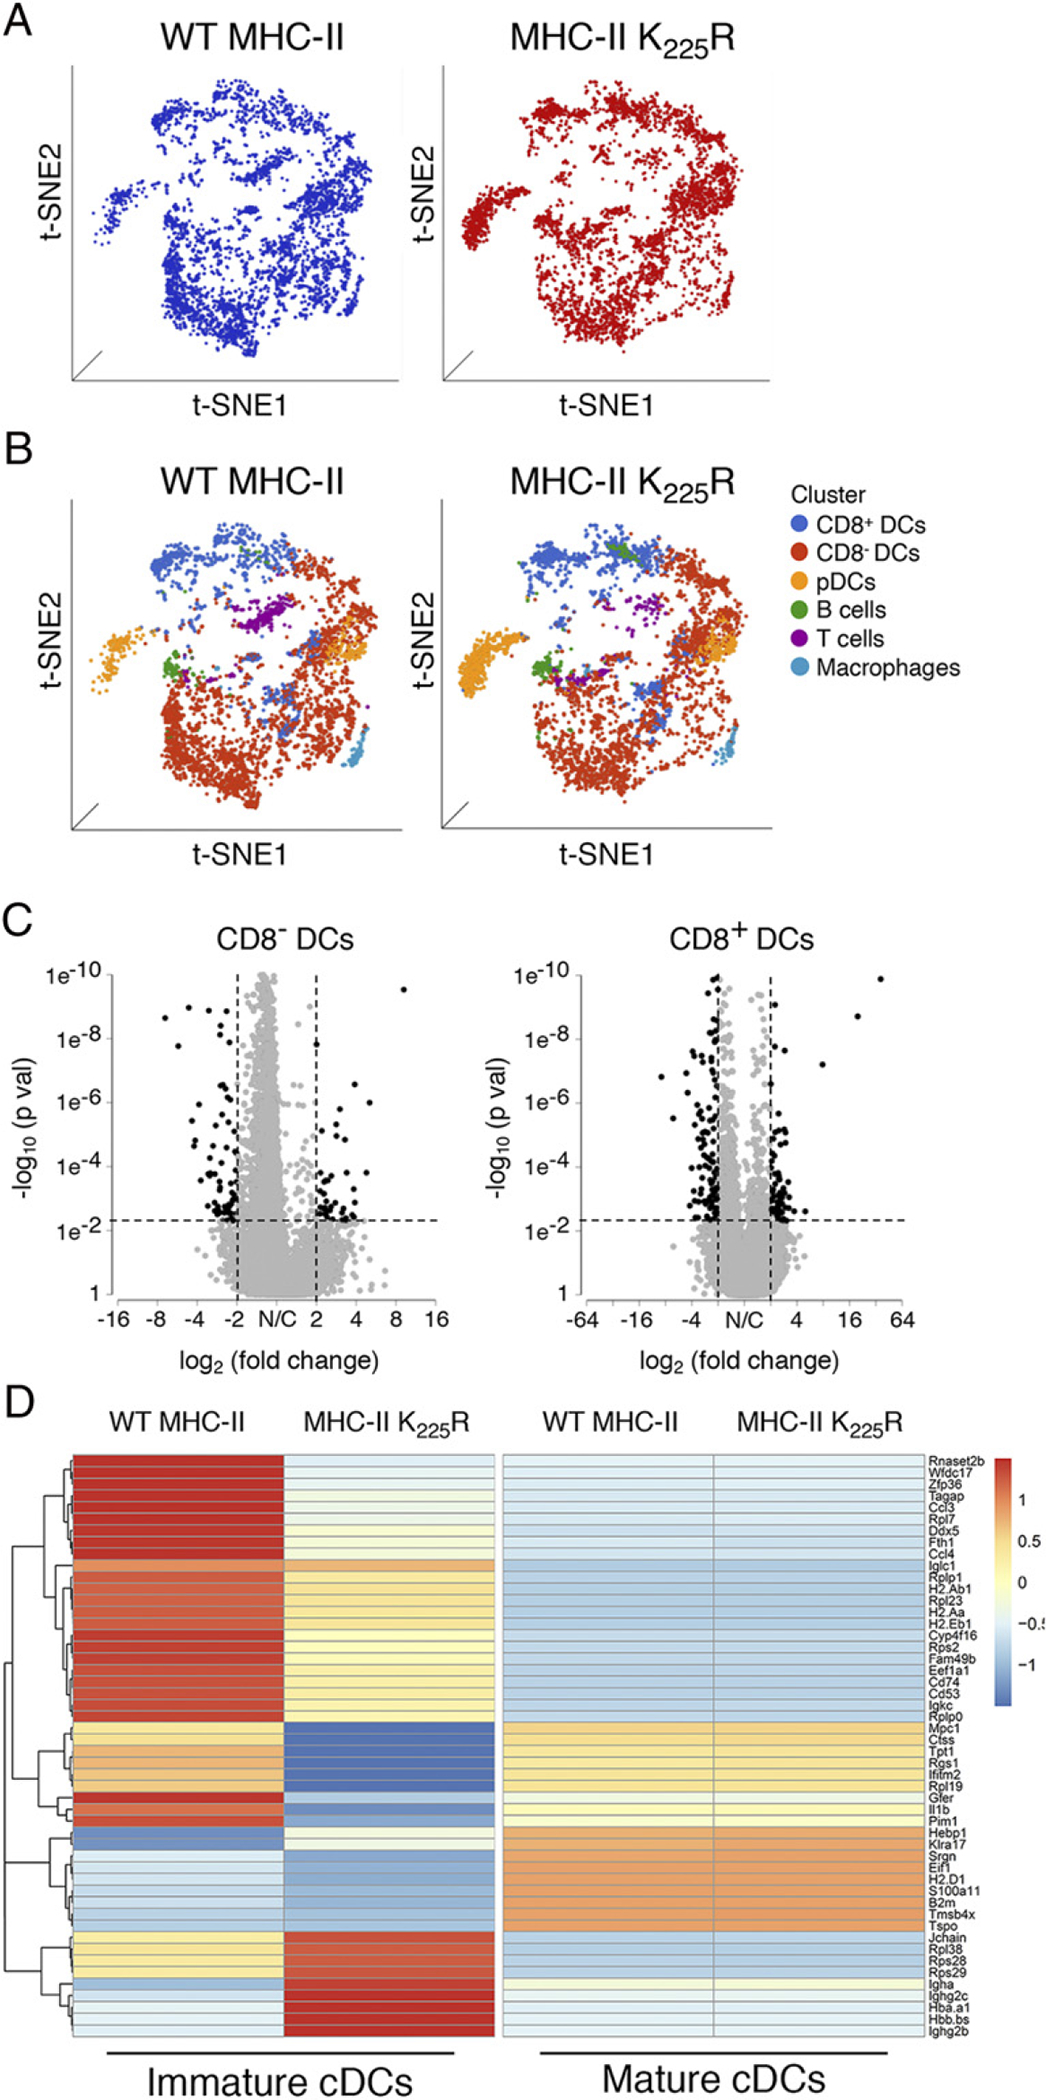
FIGURE 9.

The MHC-II K225R mice DC have an altered gene expression signature as compared with WT DCs. (A) tSNE visualization of whole-spleen DCs samples from WT and MHC-II K225R mutant mice. (B) Identification of cell populations present in the spleen DC samples from WT and MHC-II K225R mutant mice was visualized by tSNE plots. Each dot represents one cell, and colors represent cell clusters as indicated. (C) Volcano plot showing the differentially expressed genes in between WT and MHC-II K225R mutant CD8− cDCs and CD8+ cDCs. Black dots indicate downregulated genes or upregulated genes, and gray dots indicate nonsignificant genes. The x- and y-axes show log2 fold change and – log10 p value, respectively. Thresholds are shown as dashed lines. (D) Heatmaps of scRNA-Seq expression data from cDCs (both CD8− and CD8+ cDCs) isolated from spleens of WT and MHC-H K225R mutant mice of the 50 most dysregulated genes in immature cDCs. The display is row scaled and indicates the relative average expression in the groups by number of standard deviations from the mean.
