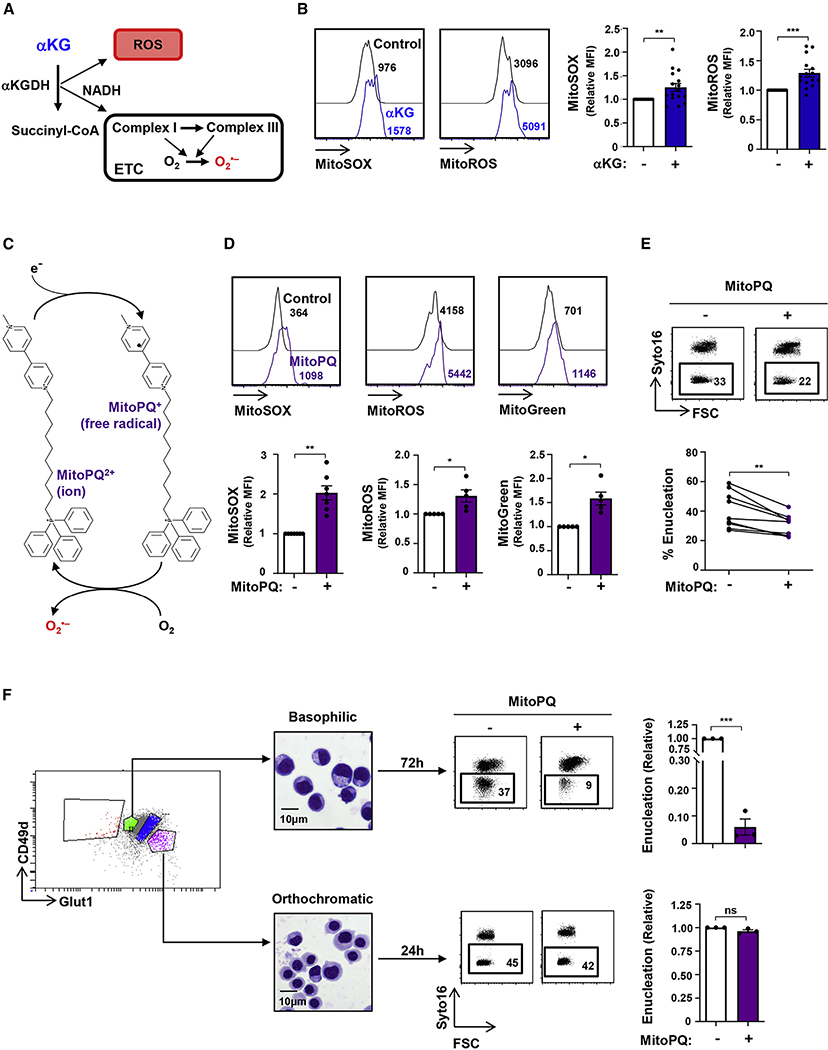
Figure 3. Mitochondrial superoxide production impedes erythroid enucleation.
(A) Schematic of the generation of mitochondrial reactive oxygen species (ROS) via the conversion of aKG to succinate, of which superoxide is a major source.
(B) The impact of αKG (3.5 mM) on mitochondrial superoxide and mitochondrial ROS production in erythroblasts was evaluated at day 10 of erythroid differentiation as a function of MitoSOX and MitoROS, respectively. Representative histograms are shown (left). Staining in the presence of αKG was normalized to control conditions, and relative median fluorescence intensities (MFIs) are presented (n = 15–16, right).
(C) Schematic of MitoParaquat (MitoPQ) cycling within the mitochondria; mitoPQ2+ is reduced to the radical monocation at the flavin site of complex I, and the monocation then reacts with O2 to generate superoxide (O2−) (Robb et al., 2015).
(D) Differentiating erythroblasts were treated with MitoPQ (50 μM) at day 7 of differentiation, and representative histograms of mitochondrial superoxide, ROS, and biomass at day 10 are presented (top). MFIs are presented relative to control conditions (n = 5–6, bottom).
(E) The impact of MitoPQ on enucleation was evaluated at day 10 by Syto16 staining, and representative dot plots are presented (top). Percent enucleation in nine independent experiments is shown (bottom).
(F) The impact of MitoPQ on early basophilic erythroblasts as compared to late orthochromatic erythroblasts was determined by FACS sorting erythroblast populations as a function of their GLUT1/CD49d profiles (left), and representative cytospins of the sorted subsets are shown (middle). Early basophilic and late orthochromatic subsets were then cultured for 72 h or 24 h, respectively, in the absence (−) or presence (+) of MitoPQ, and enucleation was evaluated (right). Enucleation was quantified relative to control conditions (n = 3).
ns, nonsignificant; *p < 0.05; **p < 0.01; ***p < 0.001.

