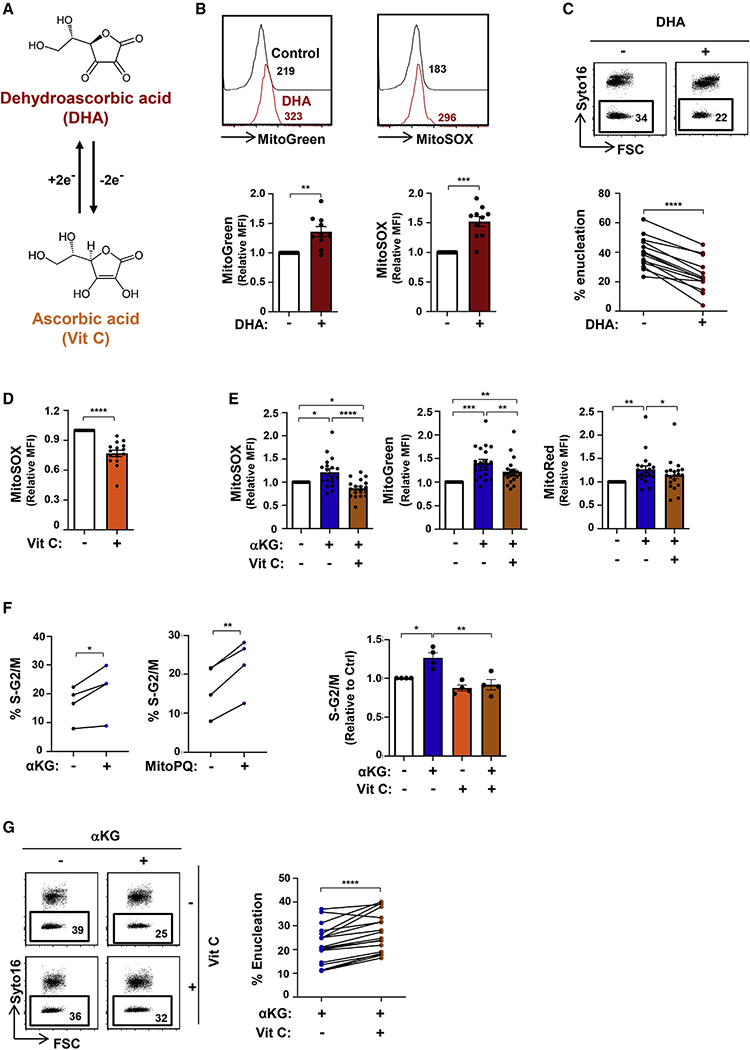
Figure 4. Antagonistic roles of dehydroascorbic acid and vitamin C on mitochondrial oxidative stress and erythroblast enucleation.
(A) Schematic of the interconversion between dehydroascorbic acid (DHA) and ascorbic acid (vitamin C) via a two-electron reduction/oxidation process, respectively.
(B) The impact of DHA (1 mM) on mitochondrial superoxide production and biomass in late erythroblasts was evaluated between days 7 and 10 after EPO induction, and representative histograms of MitoGreen and MitoSOX staining, respectively, are shown (top). Quantification relative to control conditions is shown (n = 10, bottom).
(C) Enucleation was evaluated at day 10 after EPO induction in the absence (−) or presence (+) of DHA (days 7–10), and representative dot plots are shown (top). Percent enucleation in 14 independent experiments is presented (bottom).
(D) The impact of the stable L-ascorbic acid (AA) 2-phosphate derivative of vitamin C (100 μM) was evaluated on mitochondrial superoxide generation (days 7–10), and MFIs were quantified relative to control conditions (n = 15, bottom).
(E) The impact of vitamin C on αKG-mediated increases in MitoSOX, MitoGreen, and MitoRed staining was evaluated by flow cytometry, and relative MFIs are presented (n = 18–20).
(F) The percentages of cells in S-G2/M of the cell cycle were evaluated in the indicated conditions by phosphatidylinositol (PI) staining (n = 4, left). The percentages of erythroid progenitors in S-G2/M were evaluated relative to control conditions, and means ± SEM are presented (right).
(G) Enucleation was evaluated in the presence or absence of vitamin C and αKG. Representative histograms (left) as well as changes in percent enucleation are presented (n = 18, right).
*p < 0.05; **p < 0.01; ***p < 0.001;****p < 0.0001.

