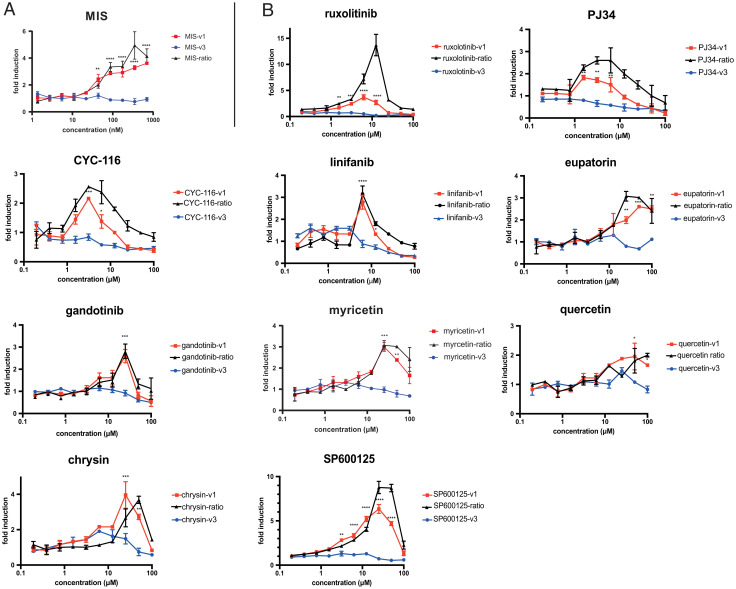
Fig. 3.
Dose–response validation of MISR2 agonist candidates and related chemical entities. Luciferase induction compared to vehicle control is plotted across a 10-point range of (A) MIS (1.36–700 nM) or (B) compounds (195 nM–100 µM), in COS7 cells transfected with either MISR2v1 in red or MISR2v3 in blue (in addition to ALK2/SMAD1/BRE-luc) and incubated for 24 h. The MISR2v1/MISR2v3 signal ratio is also plotted in black (n = 2 replicates, mean ± SEM, *P < 0.05, ***P < 0.005).

