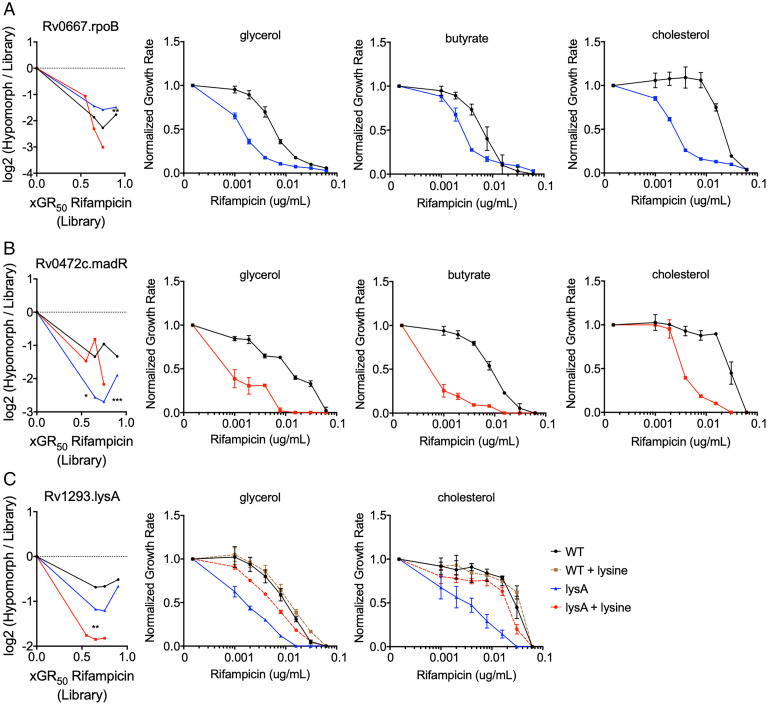
Fig. 3.
Condition-independent chemical–genetic interactions can be reproduced with individual mutants. (A) Leftmost panel: RpoB depletion shows decreased fitness compared to the library over increasing concentrations of RIF for glycerol (black), acetate (blue), and cholesterol (red). Remaining panels: Normalized growth inhibition assay shows rpoB hypomorph mutant (blue) has decreased RIF MIC compared to WT (black) across multiple carbon conditions. (B) Leftmost panel: MadR depletion shows decreased fitness compared to the library over increasing concentrations of rifampicin for glycerol (black), acetate (blue), and cholesterol (red). Remaining panels: Normalized growth inhibition assay shows madR hypomorph mutant (red) has decreased RIF MIC compared to WT (black) across multiple carbon conditions. (C) Leftmost panel: LysA depletion shows decreased fitness compared to the library over increasing concentrations of rifampicin for glycerol (black), acetate (blue), and cholesterol (red). Remaining panels: Normalized growth inhibition assay shows lysA hypomorph mutant (blue) has decreased RIF MIC compared to WT (black), which can be reversed by 3 mM lysine supplementation (red). Library results in leftmost panels are shown as means from five biological replicates, and significance was calculated using unpaired t test with Benjamini–Hochberg multiple testing correction, *q < 0.05, **q < 0.01, ***q < 0.001. Normalized growth inhibition results in remaining panels are shown as means from three biological replicates with SDs.

