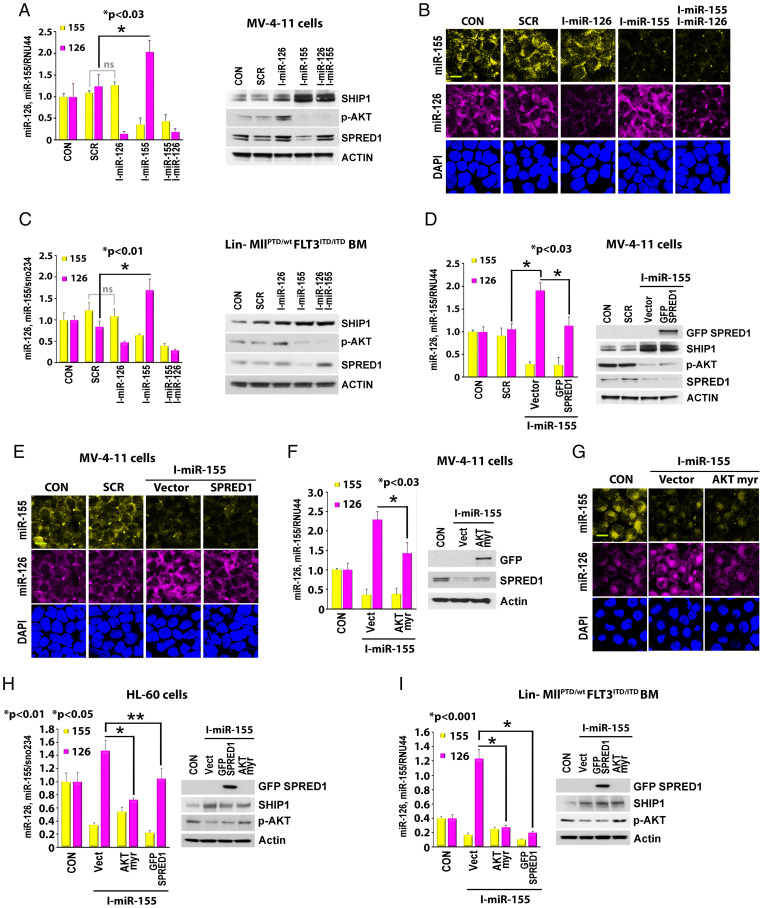
Fig. 3.
Regulation of miR-126 by miR-155. (A–C) Effects of miR-155 inhibition on SHIP1/p-AKT/SPRED1 signaling and miR-126 expression. MV-4–11 cells (A and B) or Lin− BM cells from MllPTD/wt/Flt3ITD/ITD AML mice (C) were treated with either miR-126 inhibitor, miR-155 inhibitor alone, or combination for 24 h. (A and C) Left, expression levels of miR-126 and miR-155 by qPCR. Right, cell lysate was immunoblotted with indicated antibodies. (*, P value.) (B) Representative images of cell staining with miR-126 and miR-155 SmartFlare probes. (D–I) Effects of SPRED1 and AKT-myr overexpression (OE) on miR-155–regulated miR-126 expression. MV-4–11 cells (D–G), HL-60 cells (H), and Lin− BM cells from MllPTD/wt/Flt3ITD/ITD AML mice (I) were treated with miR-155 inhibitor in the presence or absence of SPRED1 or AKT-myr OE. (D, F, H, and I) Left, expression levels of miR-126 and miR-155 by qPCR. Right, cell lysate was immunoblotted with indicated antibodies. (*, P value.) (E and G) Representative images of cell staining with miR-126 and miR-155 SmartFlare probes (Scale bar, 10 μm).

