Fig. 3.
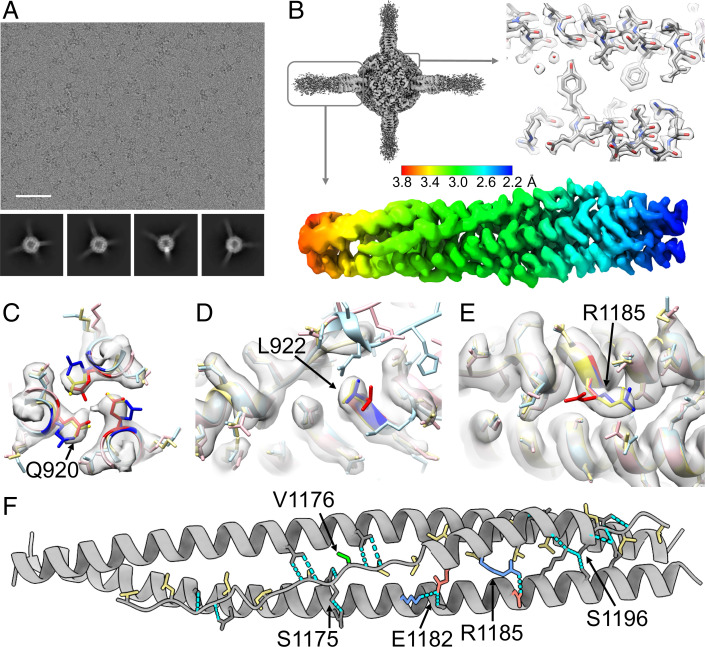
Cryo-EM studies of the scaffolded HR1HR2 complex. (A) Representative raw EM micrograph of the scaffolded wild-type HR1HR2 bundle and reference-free 2D class averages using a total of 2,896,745 selected particles (2D classification in cryoSPARC; SI Appendix, Fig. S4). The box size of the 2D class averages is 326.5 Å. (Scale bar on the raw micrograph, 500 Å.) (B) The globally refined map of the scaffolded HR1HR2 bundle shows the clearly resolved dodecameric NpDps4 scaffold region and four HR1HR2 complexes that are projecting from the scaffold with progressively increasing disorder. Symmetry expansion, signal subtraction, and local refinement resolve the HR1HR2 complexes, typically achieving resolutions ranging from 2.2–3.8 Å (SI Appendix, Fig. S4). (C–E) Comparison of the EM map (gray) of the wild-type SARS-CoV-2 HR1HR2 complex (yellow, this study) with two published crystal structures of the HR1HR2 bundle (PDB ID codes 6xlt, pink, and 6m1v, light blue), focusing on the residues with discrepant side-chain conformations between the two crystal structures. Residues Q920, L922, and R1185 of the two crystal structures are colored as red and blue, respectively, to emphasize the differences. (F) Analysis of key interactions between the HR1 and HR2 fragments. Residues of HR2 that are involved in hydrophobic interactions with HR1 are colored yellow. Note that the variant mutation V1176 (colored green) is not interacting with HR1. Hydrogen bonds are shown as cyan dashed lines. Salt bridges are indicated by positively charged residues (colored blue) and negatively charged residues (colored red). Only one HR2 protomer and its neighboring two HR1 protomers are shown for clarity.

