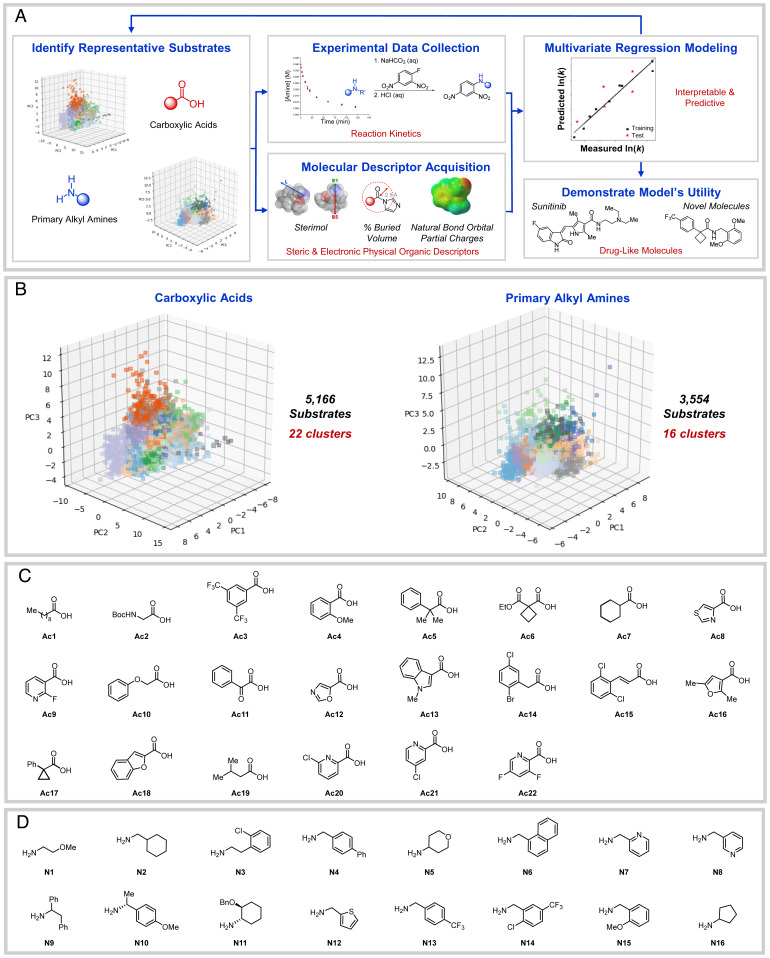
Fig. 1.
(A) Project workflow. (B) PCA plots showing clusters by color for carboxylic acids in 22 clusters and primary alkyl amines in 16 clusters. Three PCs describe 57.2% (72.6% in 5 PCs) of the variance in the acids and 59.5% (78.1% in 5 PCs) of the variance in the amines. (C) Selected carboxylic acids and (D) primary alkyl amines for training set substrates.

