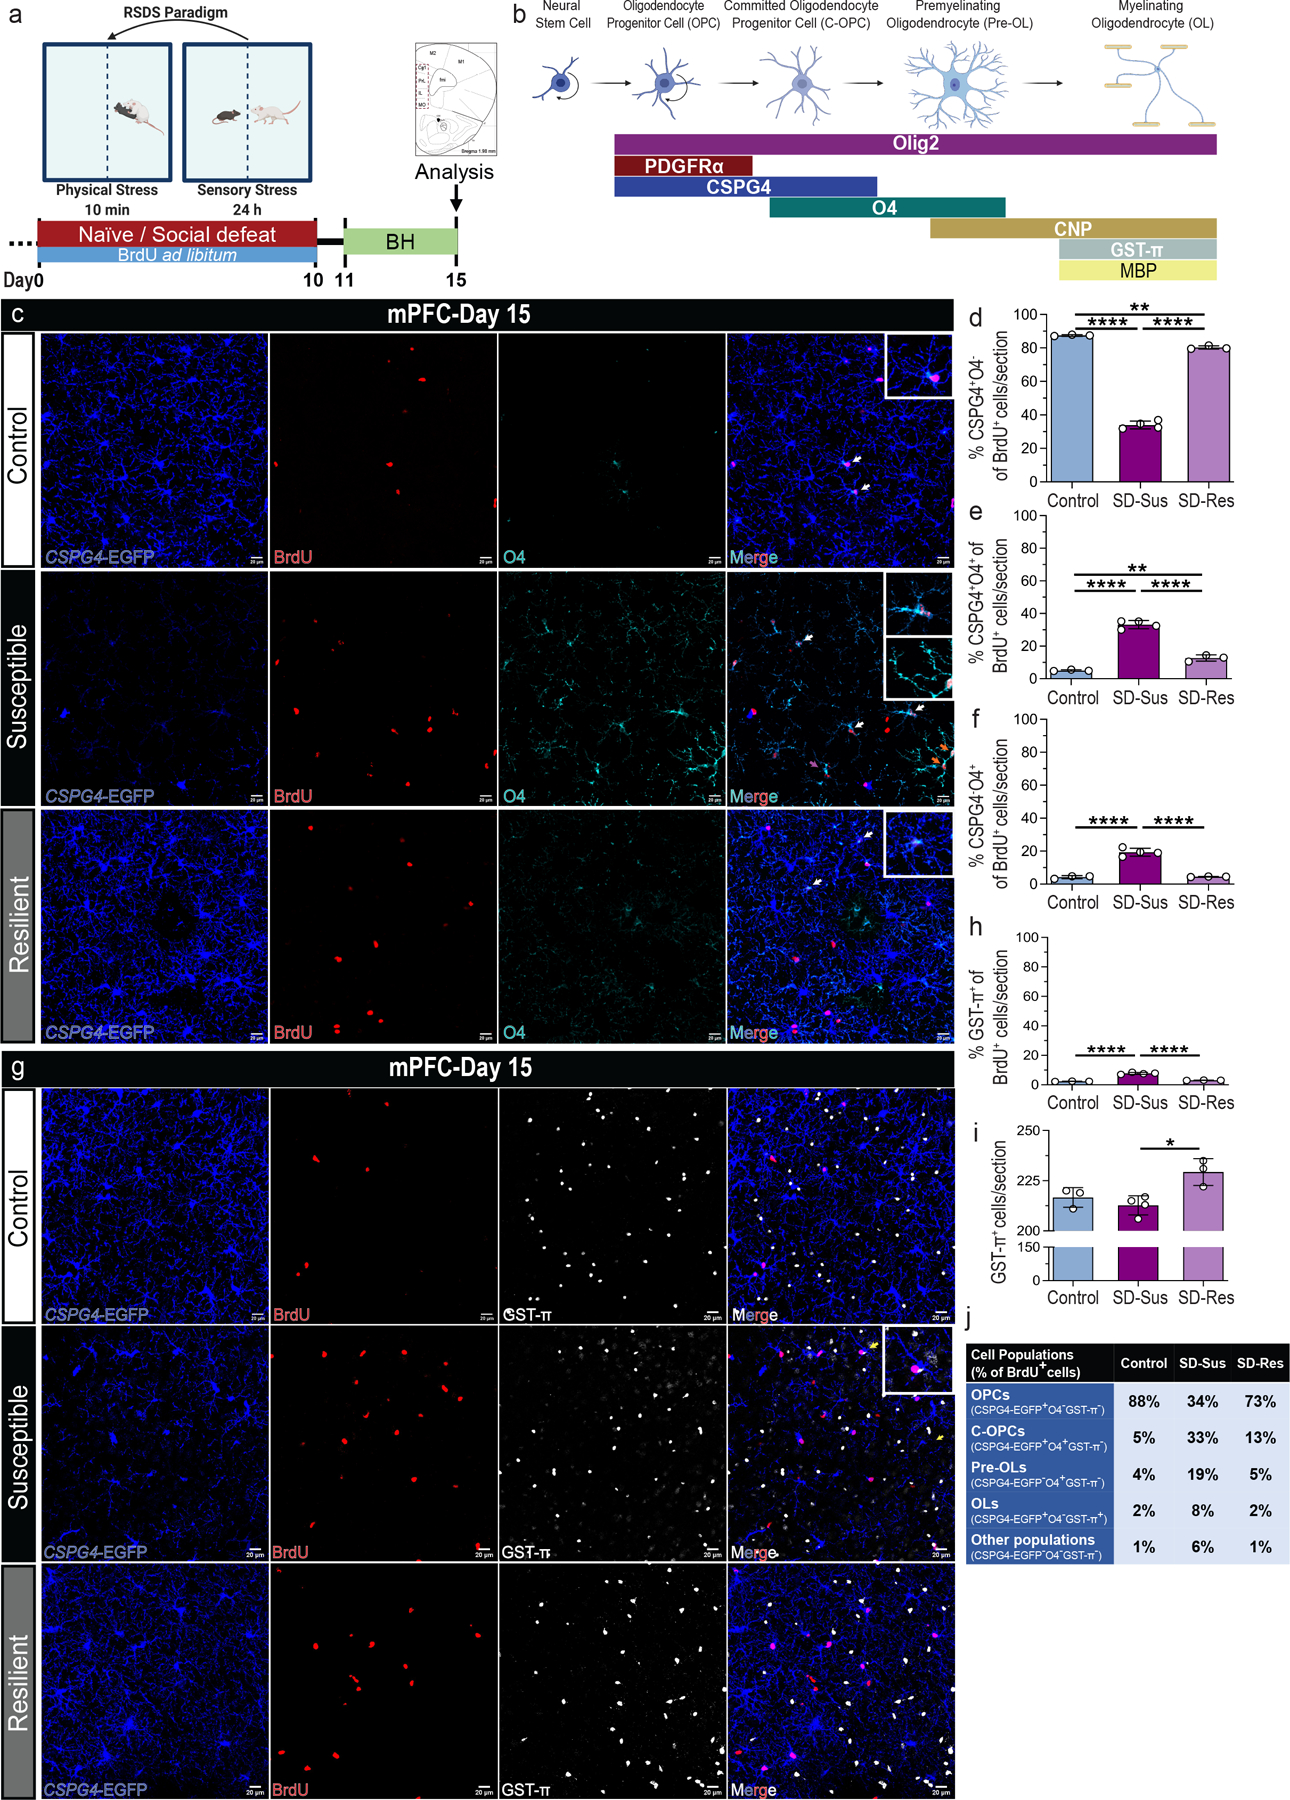
Fig. 2 |. Chronic psychosocial stress induces the maturation of label-retaining OPCs into OLs post-RSDS in the mPFC.

(a) Experimental outline of RSDS and BrdU administration. (b) Graphical representation of oligodendroglial lineage (OLN) stage and respective markers used in this study [Oligodendrocyte progenitor cells (OPCs), committed oligodendrocyte progenitor cells (C-OPCs), premyelinating immature oligodendrocytes (Pre-OLs) and myelinating mature oligodendrocytes (OLs)]. (c) Representative images of BrdU+ (red) label-retaining OPCs (CSPG4+; blue) and C-OPCs/Pre-OLs (O4+; cyanine) in mPFC; Scale bars: 100 μm (left), 20 μm (right). (d) Percentage of BrdU-retaining OPCs (BrdU+CSPG4+O4−) in the total BrdU+ population (% CSPG4+O4− of BrdU+; F2,7 = 1146, ****P ≤ 0.0001). (e) Percentage of BrdU-retaining C-OPCs (BrdU+CSPG4+O4+) in the total BrdU+ population [% CSPG4+O4+ of BrdU+; F2,7 = 196.9, ****P ≤ 0.0001; indicated by white arrows and displayed in the top insets of (c)]. (f) Percentage of BrdU-retaining Pre-OLs (BrdU+CSPG4−O4+) in the total BrdU+ population [% CSPG4−O4+ of BrdU+; F2,7 = 102.7, ****P ≤ 0.0001; indicated by red arrows and displayed in the bottom inset of SD-Sus group in (c)]. (g) Representative images of BrdU+ (red) retaining OPCs (CSPG4+; blue) and OLs (GST-π+; grey) in mPFC; Scale bars: 100 μm (left), 20 μm (right). (h) Percentage of BrdU-retaining OLs (BrdU+GST-π+) in the total BrdU+ population [% GST-π+ of BrdU+; F2,7 = 166.9, ****P ≤ 0.0001; indicated by yellow arrows and displayed in the top inset of SD-Sus group in (g)]. (i) OL density (GST-π+; F2,7 = 8.37, *P = 0.0139 (j) Summary table with percentages of each OLN cell population versus the total number of BrdU+ cells. IHC: Con: n=4, SD-Sus: n=5, SD-Res: n=4; Scale bars: 100 μm (left), 20 μm (right). For panels (d-f, h-I): one-way ANOVA with Tukey’s multiple comparisons; Con: n=3, SD-Sus: n=4, SD-Res: n=3. Data are reported as mean ± S.D; *P ≤ 0.05, **P ≤ 0.01, ****P ≤ 0.0001. Statistical analysis details are reported in Supplementary Table 1.
