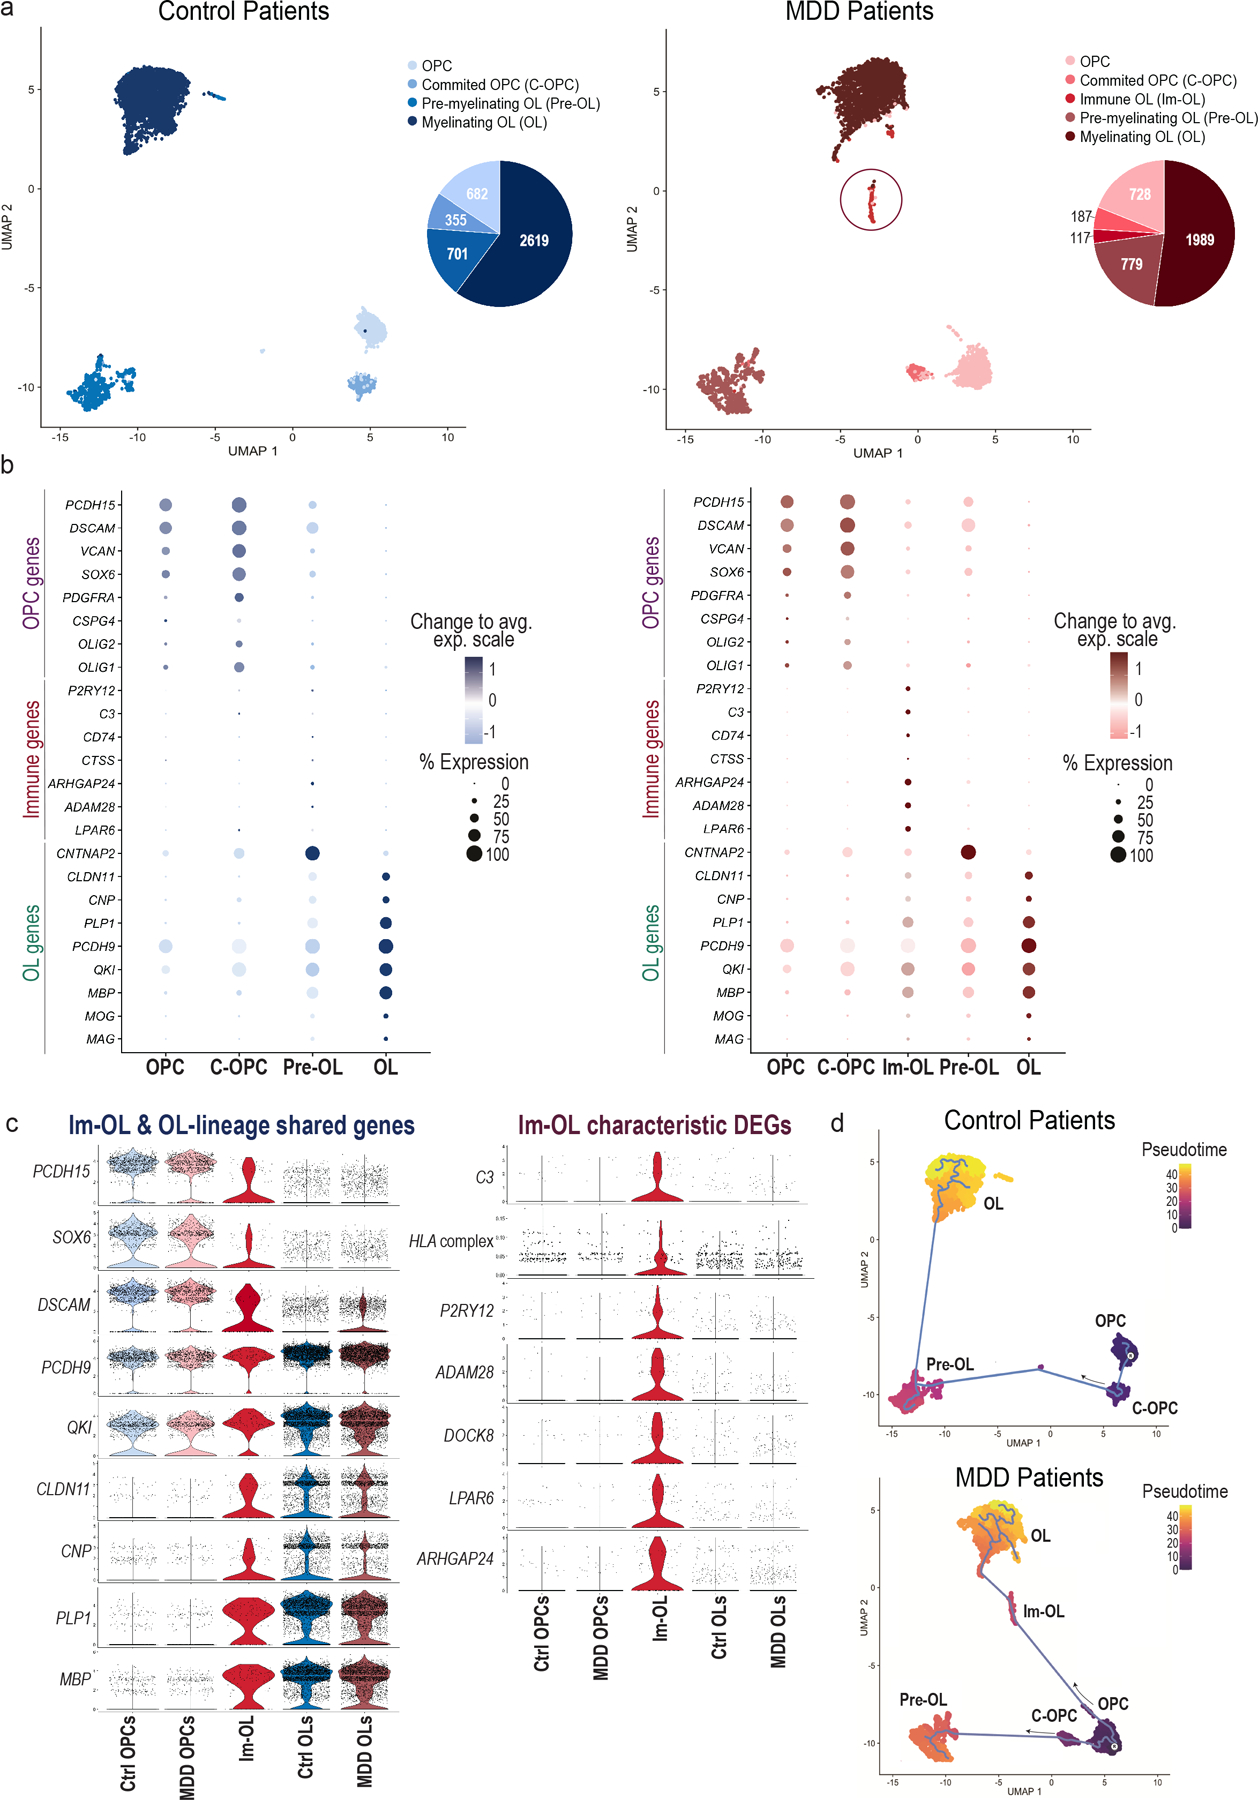
Fig. 4 |. Single-nucleus transcriptomic characterization of oligodendroglial-lineage populations in the dlPFC of MDD and Control patients.

(a) Uniform Manifold Approximation and Projection (UMAP) clustering of oligodendroglial lineage (OLN) cells per condition: Control (blue shades) and MDD (red shades) patients (n.neighbors = 20, min.dist = 0.2). OLN clusters were annotated and subsetted based on well-established marker genes (see Methods) for each condition: four common clusters (OPCs, C-OPCs, Pre-OLs, OLs) and an MDD-specific cluster (Im-OL in red circle) were identified from the analysis. On the right of each UMAP clustering, pie charts indicate the raw cell numbers from each cluster. (b) Dotplots depicting the top expressed known marker genes [early OLN genes (OPC genes), immune-related genes (Immune genes) and late OLN genes (OL genes)] in the clusters of interest. OLN gene markers are color-coded with blue shades in control and with red shades in MDD patients. The color intensity represents the average expression levels (Change to avg. exp. scale), while the size of the dots represents the percentage of cells within each cluster expressing the gene (% Expression). (c) Violin plot of top expressed oligodendroglial-lineage marker genes shared in Im-OL and OLN clusters and divided per condition [Control (blue) and MDD (red)]. (d) Violin plot of characteristic differentially expressed genes (DEGs) in Im-OL, divided per condition (Control and MDD). The HLA complex includes grouped gene scoring from the human leukocyte antigen (HLA) family; For the violin plots (c, d) the OPCs and Committed OPCs clusters are grouped and termed as OPCs. Immature Pre-myelinating OLs and Mature-Myelinating OLs clusters are grouped and termed as OLs; The values extend from minimum to maximum and the n value per cluster corresponds to the total no. of cells (represented by dots) for each condition. (e) Pseudotime trajectory analysis of oligodendroglial developmental stages divided per condition [Control (top), MDD (bottom)]. “R” marks the OPCs, the root starting point used for graph learning. The cell color indicates the pseudotime trajectory (pseudotime). OPCs: Oligodendrocyte progenitor cells; C-OPCs: committed-oligodendrocyte progenitor cells; Pre-OLs: premyelinating immature oligodendrocytes; OLs: myelinating mature oligodendrocytes (OLs); Im-OL: immune-oligodendrocytes; dlPFC: dorsolateral prefrontal cortex.
