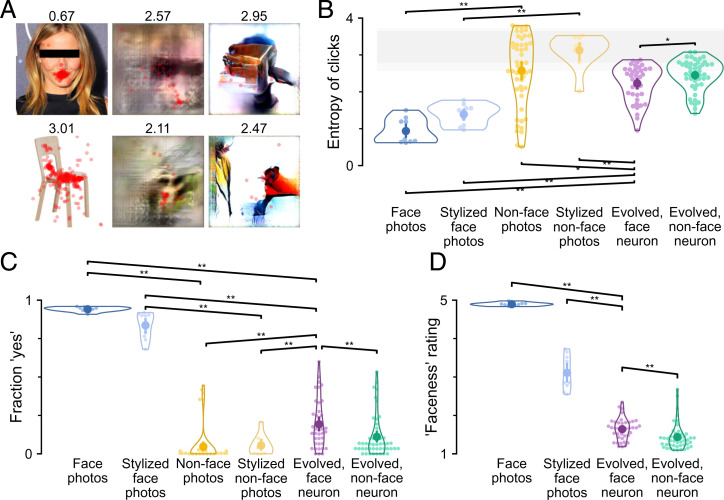
Fig. 5.
Experiments 4 to 6: locating the mouth, binary classification, and rating of faceness. (A) In experiment 4, subjects were asked to click on the mouth (Fig. 1C). Click locations are shown for six example images. (B) The swarm plot shows the entropy of click locations for each image across subjects. Shading indicates permutation 95% CIs at the image (lighter gray) or group level (darker gray) when click locations were permuted across images to represent the null hypothesis that there was no difference across images. (C) In experiment 5, subjects indicated whether or not an image contained a face (Fig. 1A). The swarm plot shows the fraction of yes answers for each image across subjects. Plot conventions follow those in Fig. 2F. (D) In experiment 6, subjects provided a faceness rating between one (not a face) and five (most face like) to each image (Fig. 1A). The swarm plot shows the average faceness ratings for each image across subjects. FDR correction was across all three tests performed. In B–D, plot conventions follow those in Fig. 2F. *P < 0.05, **P < 0.01, one-tailed permutation test with test direction indicated by the slope of the square bracket, FDR corrected across all seven tests performed in B, C, and all three tests performed in D.

