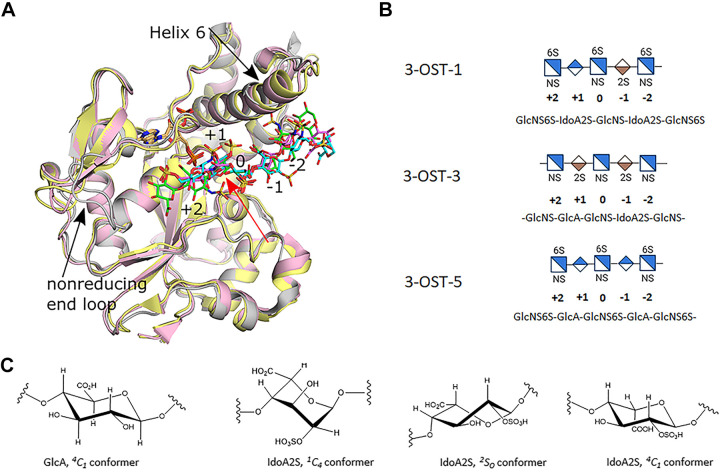
Figure 2.
Crystal structures of 3-O-sulfotransferase (3-OST) isoforms-1, -3, and -5. A: superpositions of the crystal structures of the catalytic domains for 3-OST-1 (pink, substrate dark pink; PDBcode 3UAN), -3 (gray, substrate green; pdbcode 6XL8), and -5 (light yellow, substrate cyan; pdbcode 7SCE). Positions of saccharides relative to the acceptor glucosamine (0) are labeled (+) for nonreducing end and (−) for the reducing end of the substrate. Black arrows denote largest structural differences between isoforms near the HS binding cleft. The PAP for all three structures is shown in tan and superimpose well. B: the shorthand representations of the central pentasaccharide unit of the oligosaccharide substrates used in the crystal studies are shown. C: conformations of GlcA and IdoA2S found in heparan sulfate/heparin. GlcA, glucuronic acid; HS, heparan sulfate; IdoA2S, 2-O-sulfo iduronic acid; PAP, 3′-phosphoadenosine 5′-phosphate.

