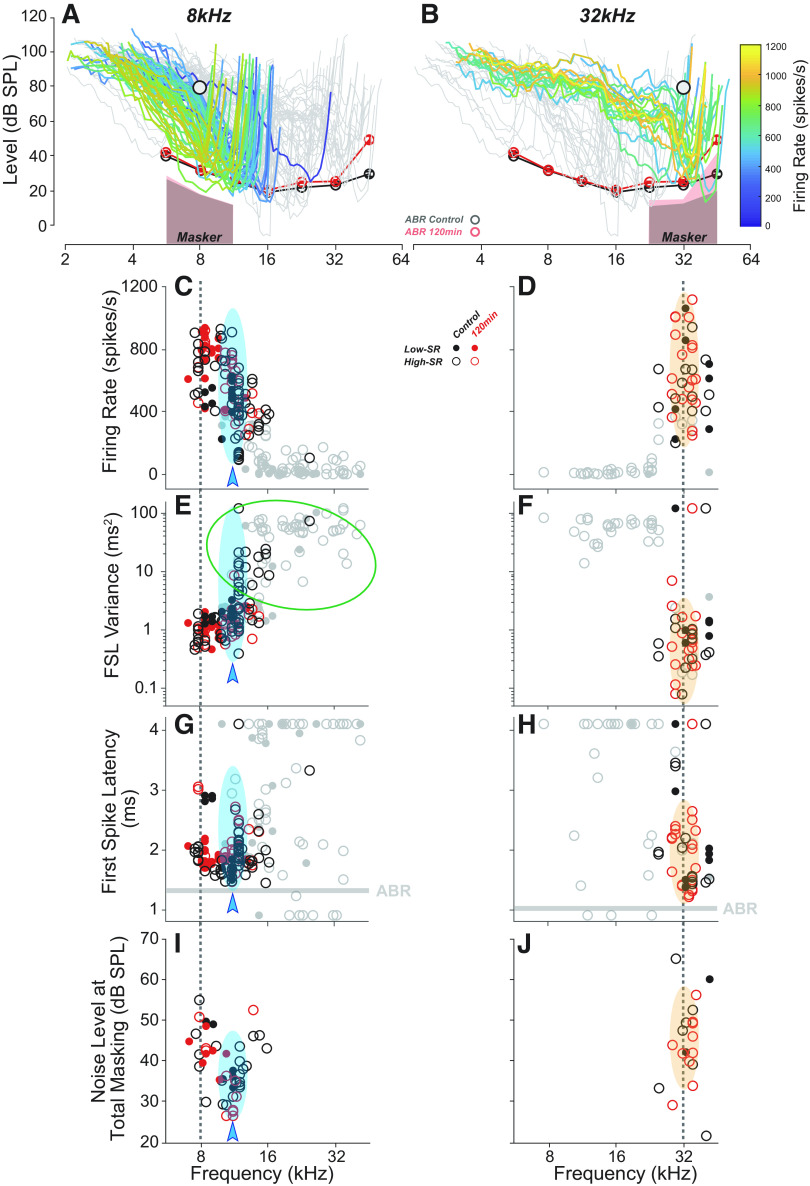
Figure 5.
Auditory-nerve fiber (ANF) responses to the 8- or 32-kHz tone pips used to evoke auditory brainstem response (ABR) responses. A and B: all the ANF tuning curves from all groups are superimposed in each panel, coded by discharge rate in response to 8- or 32-kHz probe tones at 80 dB SPL in quiet, as indicated. Fibers not responding to the probe-tone pips (P > 0.05 for a paired t test comparing “tone-on” vs. “tone-off” spike counts) are in gray; others are color coded for onset rate as shown in the color bar to the right. Mean ABR thresholds (from Fig. 2A) and masker spectra are shown for reference. Key features of the ANF responses to either 8 kHz (C, E, G, and I) or 32 kHz (D, F, H, and J) tone pips at 80 dB SPL, as indicated on the vertical axis for each row. Symbol code in C applies to all panels. Firing rate (C and D) is averaged over the entire tone-pip duration (5 ms), and noise level at total masking (I and J) is as defined in Fig. 1D. Probe tone frequency is indicated by the vertical dashed lines. Relevant ABR P1 latencies are indicated by the horizontal bars in G and H, and the cyan arrowheads and bubbles in C, E, G, and I are positioned at the characteristic frequency (CF) region showing minimum response latency (G). The green oval in E indicates the same population of off-CF responses encircled in Fig. 6C. As for A and B, gray symbols denote fibers not responding to the tone pips. Symbols aligned at the max or min of the ordinate have off-scale values. FSL, first spike latency; SR, spontaneous rate.

