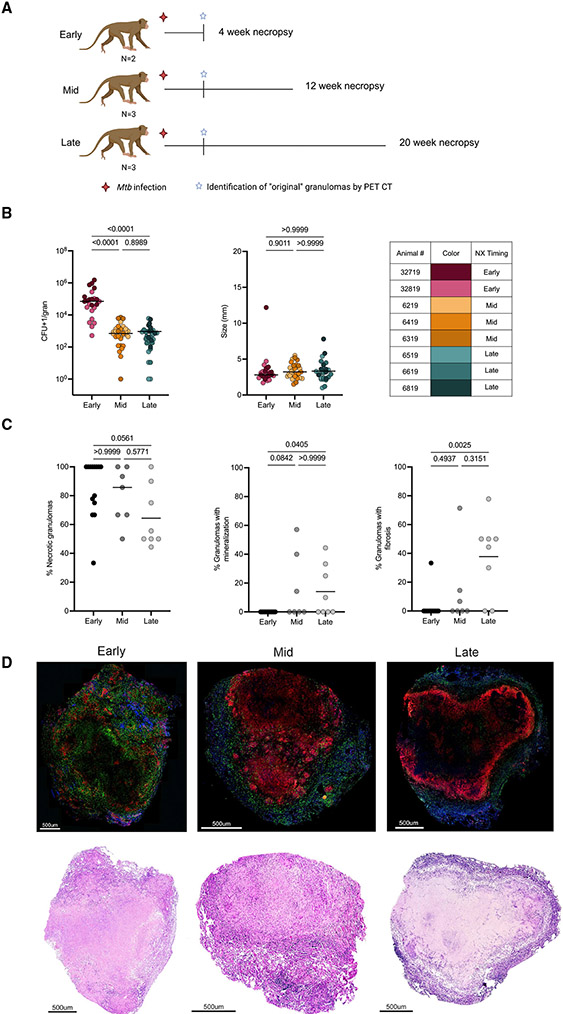
Figure 1. Study design, original granuloma dynamics, and pathology over time.
(A) Eight Chinese cynomolgus macaques were infected with low-dose (10–19 colony-forming units [CFUs]) Mtb Erdman and followed for 4 (early), 12 (mid), or 20 (late) weeks post-infection. Original granulomas were defined as those first observed on the 4 weeks post-infection PET CT scan.
(B) Individual granuloma bacterial burden (CFUs) and size (mm) from PET CT. Individual points represent original lung granulomas (early: n = 24, mid: n = 31, late: n = 33). Table indicates each animal number and associated color in graphs.
(C) Histologic characteristics of original lung granulomas in individual animals (frequency of each granuloma type) of banked samples at early, mid, and late time points categorized by H&E descriptions. Data points represent individual animals (N = 14 early, 7 mid, and 8 late animals).
(D) Representative images of immunofluorescence staining for CD3 (green), CD11c (red), and CD163 (blue) with paired H&E staining of original granulomas from the early, mid, and late time points.
For (B) and (C) statistics, Kruskal Wallis tests were performed, with Dunn’s multiple comparisons-adjusted p values reported on the graphs.

