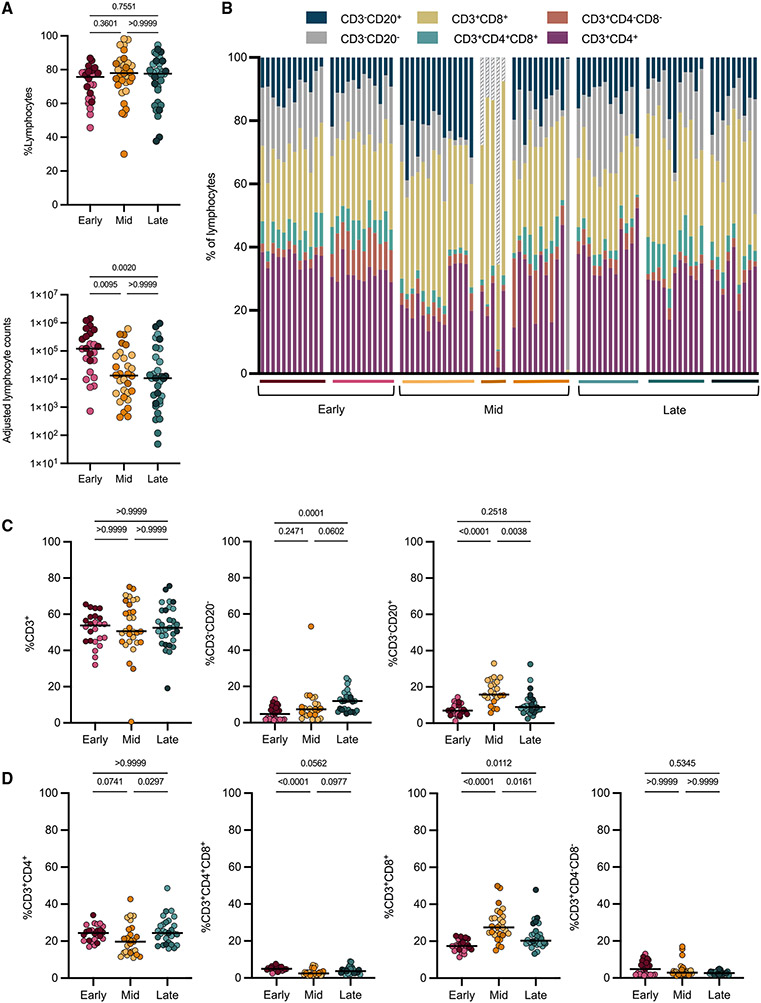
Figure 2. Few differences were observed in lymphocyte populations in original granulomas across time points.
Original granulomas at each time point were evaluated for cellular composition by flow cytometry.
(A) Frequency (top) and numbers (bottom) of lymphocytes. Each symbol is a granuloma.
(B) Relative proportions of each cell type (percentage of lymphocytes) in individual granulomas. Each column is a granuloma and is separated by macaque (colored horizontal bar) and time point.
(C) Frequency of CD3+, CD3−CD20−, and CD3−CD20+ of all live cells.
(D) Frequency of CD4+, CD4+CD8+, CD8+, and CD4−CD8− of all live cells.
For (A), (C), and (D) statistics, Kruskal Wallis tests were performed, with Dunn’s multiple comparisons-adjusted p values reported on graphs.

