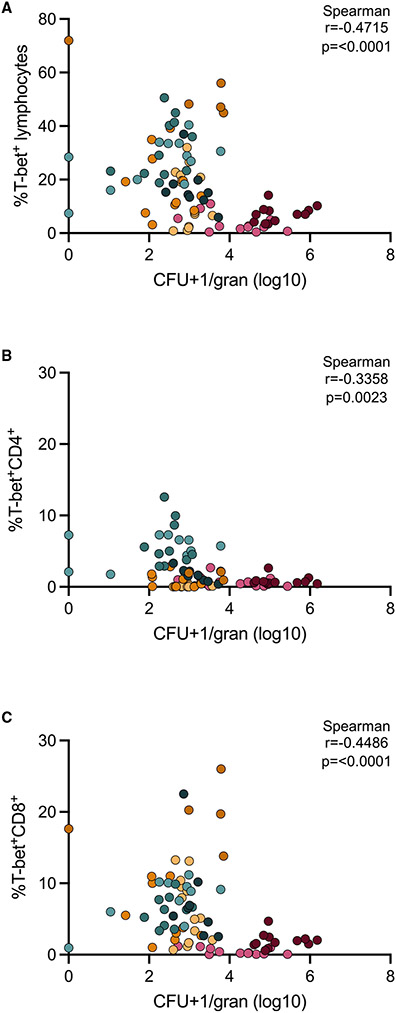
Figure 7. Bacterial burden negatively correlates with frequencies of T-bet+ lymphocytes.
(A) Frequency of T-bet+ lymphocytes versus log10 CFUs per granuloma.
(B) Frequency of T-bet+CD4+ versus log10 CFUs per granuloma.
(C) Frequency of T-bet+CD8+ T cells versus log10 CFUs per granuloma. Data from all time points (early, mid, and late) are included in this analysis and colored according to animal (as previously indicated). CFUs per granuloma were log transformed after adding 1 (to avoid having undefined values). Non-parametric Spearman correlation analyses were performed, with rho and p values noted on individual graphs.

