Figure 2.

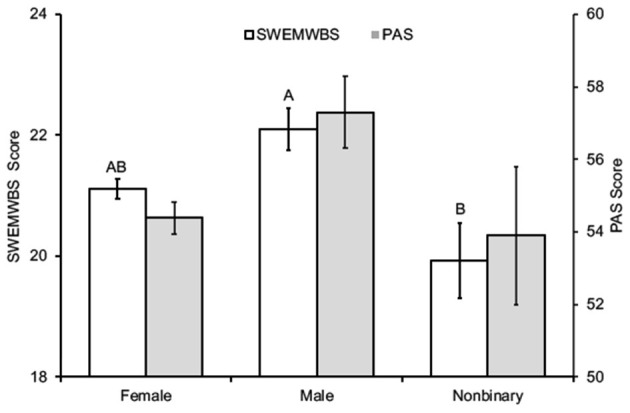
SWEMWBS and PAS scores according to gender (mean ± SEM). Different letters for SWEMWBS scores indicate different statistical groupings (p < 0.05).

SWEMWBS and PAS scores according to gender (mean ± SEM). Different letters for SWEMWBS scores indicate different statistical groupings (p < 0.05).