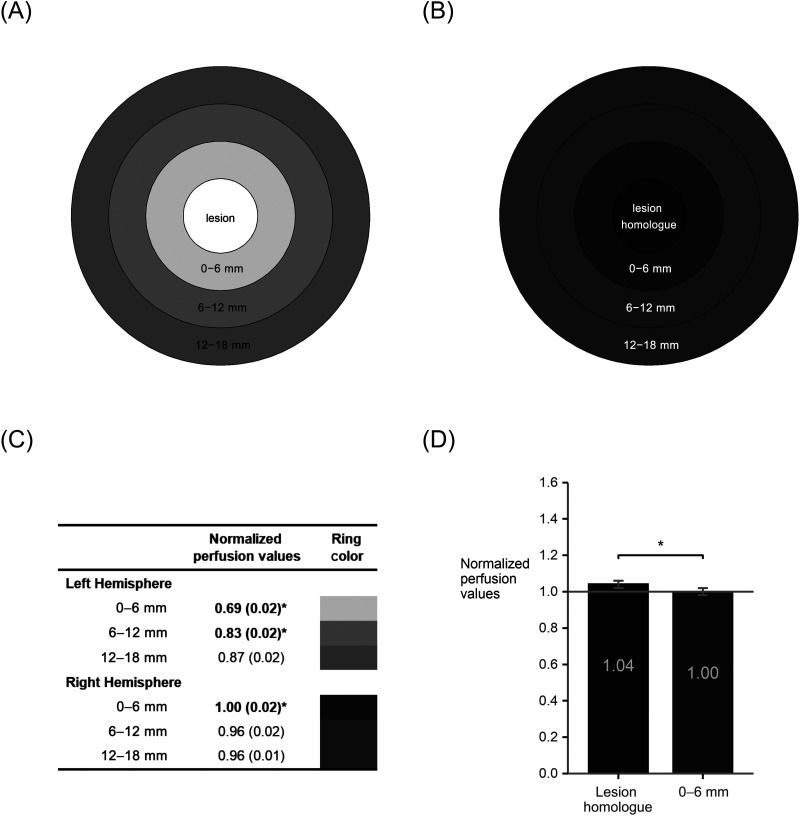
Figure 2. .
Pre-treatment perilesional perfusion in left hemisphere (LH) perilesional rings (A) and their right hemisphere (RH) homologues (B). Ring color is scaled to perfusion values, with lighter grays for lower perfusion values and darker grays for higher perfusion values. A table (C) shows normalized perfusion values and standard error for each perilesional ring and its RH homologue, with scaled colors corresponding to the rings in (A) and (B). Values with * and in bold indicate that the smaller ring is significantly different from the next larger ring within the same hemisphere (q < 0.05). For all three rings, perfusion was significantly lower in the LH than the RH (q < 0.05; see text). An additional analysis (D) revealed significantly elevated perfusion for lesion-homologous tissue in the right hemisphere relative to the RH 0–6 mm ring (p < 0.0001). All perfusion values are normalized to a right occipital cortical ROI.

