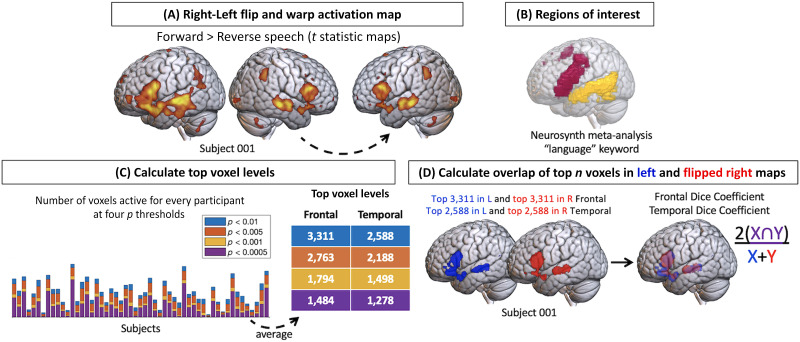
Figure 1. .
Analysis workflow. We (A) flipped the activation map for each participant, (B) masked activation in regions of interest (language regions defined by a meta-analysis database), (C) applied a top voxel cutoff to equalize the quantity of activation within the ROI in the left and flipped right maps, and (D) calculated the spatial overlap in the left and flipped right activation areas with a dice coefficient. L: left, R: right.

