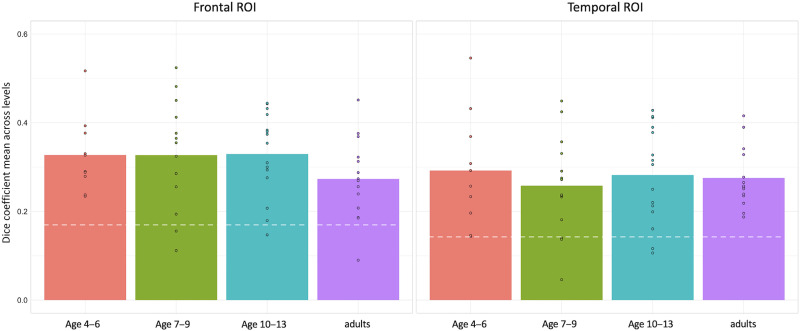
Figure 2. .
Average homotopicity for each age group. The pairwise dice coefficient averages for individual participants were binned by age group. There were no mean differences in the average homotopic overlap between age groups (means and standard deviations in Table 3, one-way ANOVAs in Tables 4 and 5). The white dashed lines indicate the dice coefficient that would be measured between random arrangements of the same number of active voxels in the same size space (0.1809 in the frontal and 0.1488 in the temporal ROI), which is substantially lower than the group means for all age groups.

