Fig. 1.
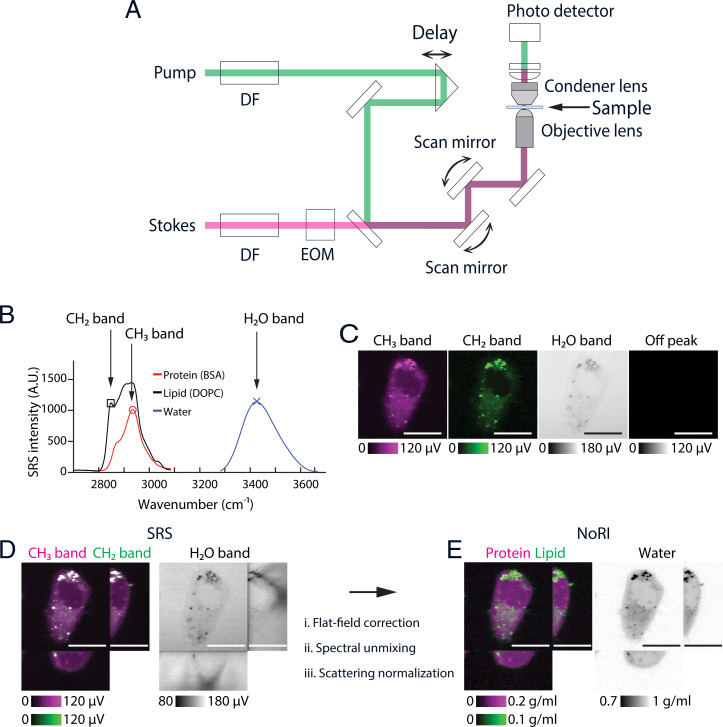
Principles of NoRI. (A) Schematic of the spectral-focusing stimulated Raman scattering microscope. Pump and Stokes femtosecond pulse lasers are chirped by dense flint (DF) glass and intensity modulated by an electrooptical modulator (EOM). Motorized delay is used to fine tune the Raman band. Transmitted pump laser intensity is detected in the transside. (B) Raman spectra of protein, lipid, and water measured by spectral-focusing stimulated Raman scattering microscope. See SI Appendix, Supplementary Methods for the acquisition parameters. Three Raman bands are measured in NoRI: CH3 (red circle, 2,935 cm−1), CH2 (black square, 2,853 cm−1), and H2O (blue X, 3,420 cm−1) bands. (C) Representative SRS images of a live A7 cell at the CH3, CH2, H2O, and off-peak Raman bands. (Scale bars, 20 µm.) (D) Orthogonal view of the SRS images in the CH3, CH2, and H2O Raman bands. (Scale bars, 20 µm.) (E) Orthogonal view of the NoRI measurement of protein, lipid, and water concentrations. (Scale bars, 20 µm.)

