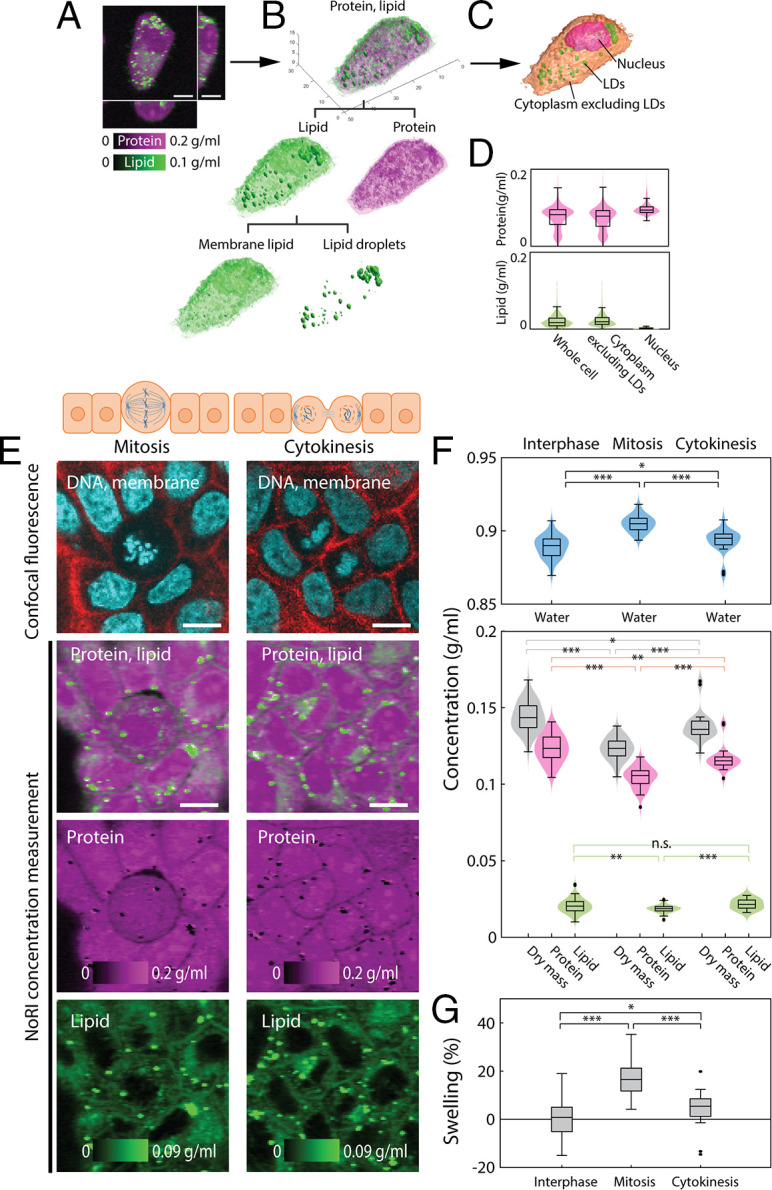
Fig. 2.

Label-free measurement of protein and lipid shows dilution of cytoplasm in mitotic cells. (A) Volumetric NoRI measurement of a live A7 cell. (Scale bar, 10 µm.) (B) Volumetric visualization of the protein and lipid distribution in the cell. Lipid is further classified as membrane lipids in the aqueous phase of the cytosol and lipid droplets. (C) Label-free volumetric segmentation of a whole cell, nucleus, and lipid droplets from NoRI data. See SI Appendix, Supplementary Methods for the segmentation method. (D) Distribution of protein and lipid concentration within the volume of the whole cell, cytoplasm excluding lipid droplets, and the nucleus in C. (E) Representative live MDCK cells in mitosis and cytokinesis. (Scale bars, 10 µm.) (F) NoRI images of mitotic and interphase cells. Mitotic cells have a more diluted cytoplasm compared to interphase cells, as revealed by lower protein and lipid concentrations and a higher water concentration (water: interphase 0.889 ± 0.008 g/mL, mitosis 0.905 ± 0.006 g/mL, P < 0.0001; dry mass: interphase 0.144 ± 0.009 g/mL, mitosis 0.123 ± 0.007 g/mL, P < 0.0001; protein: interphase 0.123 ± 0.009 g/mL, mitosis 0.105 ± 0.007 g/mL, P < 0.0001; and lipid: interphase 0.021 ± 0.005 g/mL, mitosis 0.019 ± 0.002 g/mL, P = 0.0052). The cytoplasmic concentration recovers toward the interphase value during cytokinesis (water 0.893 ± 0.008 g/mL, dry mass 0.138 ± 0.010 g/mL, protein 0.117 ± 0.008 g/mL, lipid 0.022 ± 0.003 g/mL). Lipid droplets are excluded from the lipid concentration calculation. The number of cells in interphase, metaphase, and cytokinesis are n = 81, n = 57, and n = 24, respectively. (G) Relative difference of cytoplasmic density, here expressed in terms of the relative volume change (“swelling”) based on the degree that a cell of interphase cells’ median cytoplasmic density would have to change to achieve the observed difference in cytoplasmic water concentration. Mean and SD of swelling are 0.5 ± 6.8%, 17.0 ± 6.8%, and 4.2 ± 7.3% for interphase, mitosis, and cytokinesis, respectively (P < 0.001 for interphase and mitosis, P = 0.020 for interphase and cytokinesis). *P ≤ 0.05, **P ≤ 0.01, ***P ≤ 0.001. n.s. is not significant with P > 0.05.
