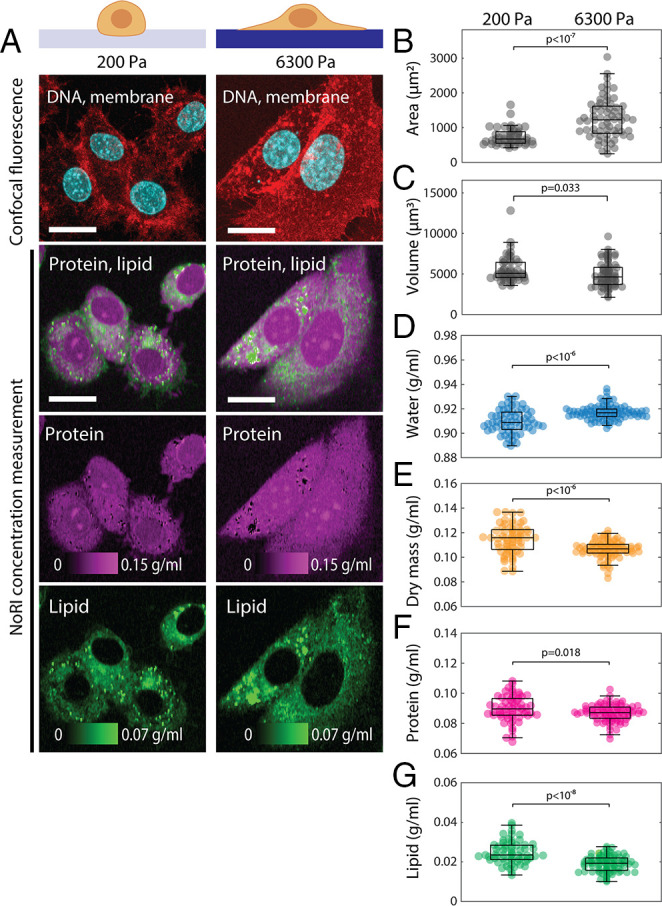
Fig. 3.

Cytoplasmic density increases in cells cultured on a soft substrate. (A) Representative images of live A7 cells cultured for 24 h on 200 Pa or 6,300 Pa polyacrylamide gels. (Scale bars, 20 µm.) (B) Cell area is greater on the stiff substrate (P < 10−7). Mean and SDs are 740 ± 250 µm2 (n = 46) and 1,264 ± 571 µm2 (n = 67) for 200 Pa and 6,300 Pa, respectively. (C) Cell volume is smaller on the stiff substrate (P = 0.033). Mean and SDs are 5,588 ± 1,672 µm2 (n = 46) and 4,921 ± 1,576 µm2 (n = 67) for 200 Pa and 6,300 Pa, respectively. (D–F) Concentration of water, dry mass (equal to the sum of protein and lipid), protein, and lipid are quantified in the single cell cytoplasm excluding lipid droplets. (D) Cytoplasmic water concentration is higher on the stiff substrate (P < 10−7). Mean and SDs are 0.9098 ± 0.0098 g/mL (n = 61) and 0.9171 ± 0.0058 g/mL (n = 84) for 200 Pa and 6,300 Pa, respectively. (E) Cytoplasmic dry mass concentration is lower on the stiff substrate (P < 10−6). Mean and SDs are 0.1147 ± 0.0118 g/mL (n = 61) and 0.1065 ± 0.0070 g/mL (n = 84) for 200 Pa and 6,300 Pa, respectively. (F) Cytoplasmic protein concentration is lower on the stiff substrate (P = 0.018). Mean and SDs are 0.0899 ± 0.0085 g/mL (n = 61) and 0.0869 ± 0.0055 g/mL (n = 84) for 200 Pa and 6,300 Pa, respectively. (G) Cytoplasmic membrane lipid concentration is lower on the stiff substrate (P < 10−8). Mean and SDs are 0.0248 ± 0.0057 g/mL (n = 61) and 0.0196 ± 0.0040 g/mL (n = 84) for 200 Pa and 6,300 Pa, respectively.
