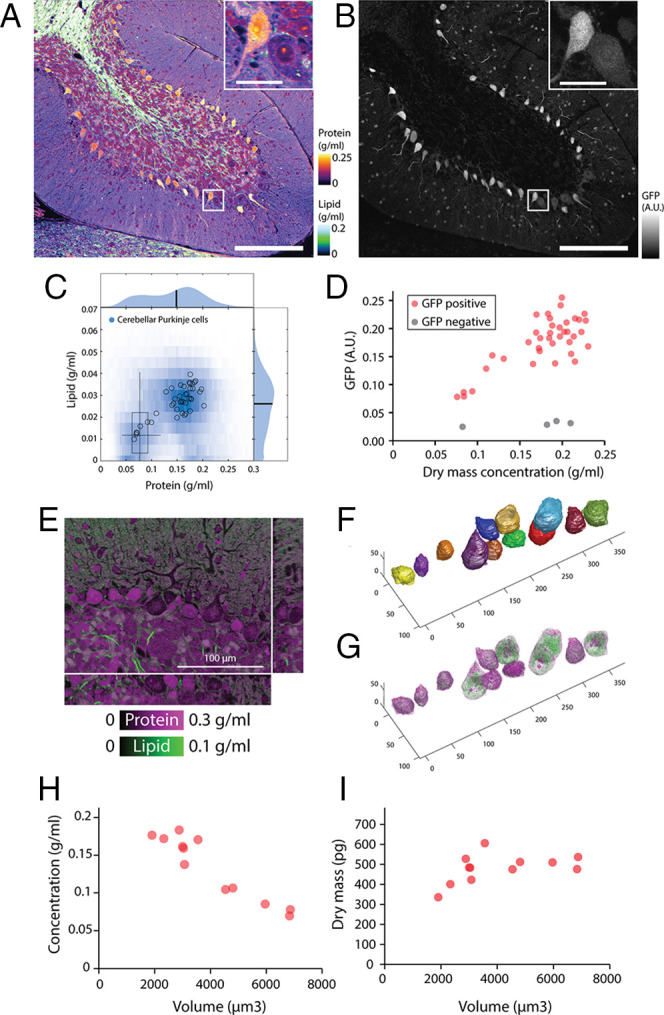
Fig. 6.

Bimodal cytoplasmic densities of Purkinje cells in the cerebellum. (A) NoRI image of fixed mouse cerebellum lobe 10. (Scale bar, 200 μm.) (Inset) Detailed view of boxed area. (Inset Scale bar, 30 μm.) (B) Confocal fluorescence of GAD67-GFP in the same area as A. Purkinje cells are identified by expression of GAD67-GFP. (C) Protein and lipid concentration distribution of all Purkinje cells (blue density plot) and individual Purkinje cells (open circles). The boxplot displays the concentration distribution of fixed HeLa cells in Fig. 5B for comparison. (D) GAD67-GFP expression level correlates with dry mass concentration in Purkinje cells (n = 38). GAD67-GFP negative cells from the Purkinje layer are also shown (n = 4). (E) Volumetric NoRI measurement of fixed mouse cerebellum. (Scale bar, 100 µm.) (F) Cell body of Purkinje neurons are manually segmented from the label-free NoRI image in E. Cell boundaries are determined from the distinct protein and lipid concentration of cells compared to the surrounding tissue. (G) Volumetric visualization of the protein and lipid distribution in the cells. (H) Cerebellar Purkinje cells decrease in cytoplasmic dry mass density with increasing cell body volume (n = 12). (I) Dry mass of the cell body of the cells shown in D.
