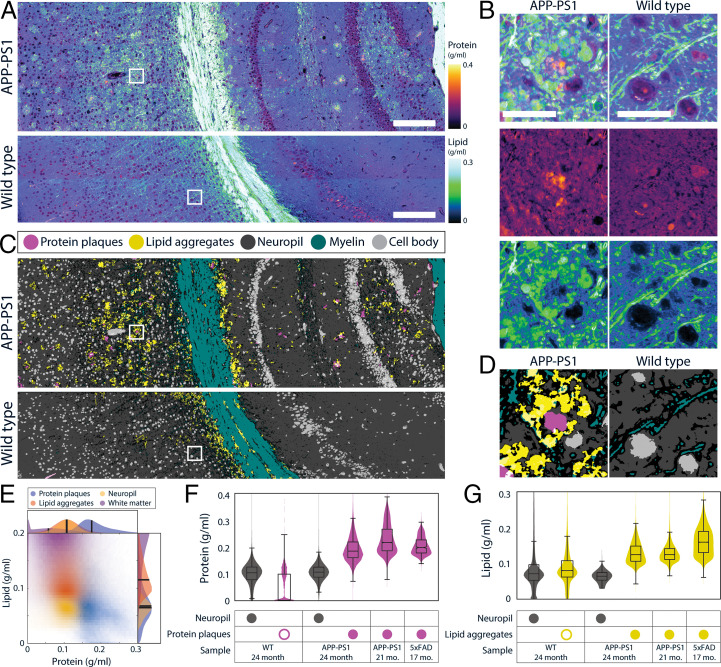
Fig. 7.
Altered protein and lipid concentrations in brain tissue from Alzheimer’s disease genetic models. (A) Protein and lipid concentration images of APP-PS1 Alzheimer model mouse and wild-type (WT) mouse brains. (Scale bars, 100 μm.) (B) Detailed view of A. APP-PS1 brain shows senile plaques with protein-dense core and lipid-rich corona. In the WT brain, high concentration lipid is localized to myelin fibers. (Scale bar, 30 μm.) (C) Tissue segmentation by using a pixel classifier based on the protein and lipid concentrations and morphological features. Both wild-type and APP-PS1 images are processed by the same parameters. Each pixel is classified as protein plaques (pink), lipid aggregates (yellow), neuropil (dark gray), myelin (green), or cell body (light gray). Ambiguous pixels at the border of two classes were left unclassified (black). Protein plaques and lipid aggregates are scattered throughout the gray matter of APP-PS1 mouse brain tissue. (D) Detailed view of C. (E) Measurement of protein and lipid concentrations of protein plaques, lipid aggregates, neuropil, and white matter classes in the APP-PS1 image in A. (F) Quantitative analysis of protein concentration in WT (n = 1) and APP-PS1 (n = 2) and 5xFAD (n = 1), two murine Alzheimer’s disease models. Protein concentration is shown for neuropil and protein plaque classes detected by the pixel classifier described above. A small number of pixels in the WT were misclassified as protein plaques (open pink circle), but their protein concentration was significantly lower than that of true protein plaques (filled pink circles). The presence of protein plaques can be quantitatively characterized by the elevated protein concentration of the protein plaque class. Control neuropil protein 0.099 ± 0.042 g/mL, protein plaques 0.044 ± 0.056 g/mL 24 mo. APP-PS1 neuropil protein 0.106 ± 0.031 g/mL, protein plaques 0.193 ± 0.047 g/mL 21 mo. APP-PS1 protein plaques 0.229 ± 0.055 g/mL 17 mo. 5xFAD protein plaques 0.205 ± 0.031 g/mL. (G) Quantitative analysis of lipid concentration in the same samples as K. Lipid concentration is shown for neuropil and lipid aggregate classes identified by the pixel classification, as described above. The presence of lipid aggregates can be detected by the high lipid concentration of lipid plaque class (filled yellow circle), which contrasts with the low lipid concentrations (open yellow circle) seen in the WT, which has a lipid concentration in neuropil 0.089 ± 0.071 g/mL. Some pixels in WT are misclassified as lipid aggregates but they can be discounted as revealed by their low lipid concentration 0.090 ± 0.053 g/mL 24-mo-old. APP-PS1 mouse tissue shows lipid concentration in lipid aggregates of 0.129 ± 0.030 g/mL, which is significantly higher than that of neuropil, 0.064 ± 0.015 g/mL. The concentrations of lipid aggregates in the 21-mo-old APP-PS1 samples and in the 16-mo-old 5xFAD mouse are similarly high at 0.129 ± 0.028 g/mL and 0.162 ± 0.040 g/mL, respectively.

