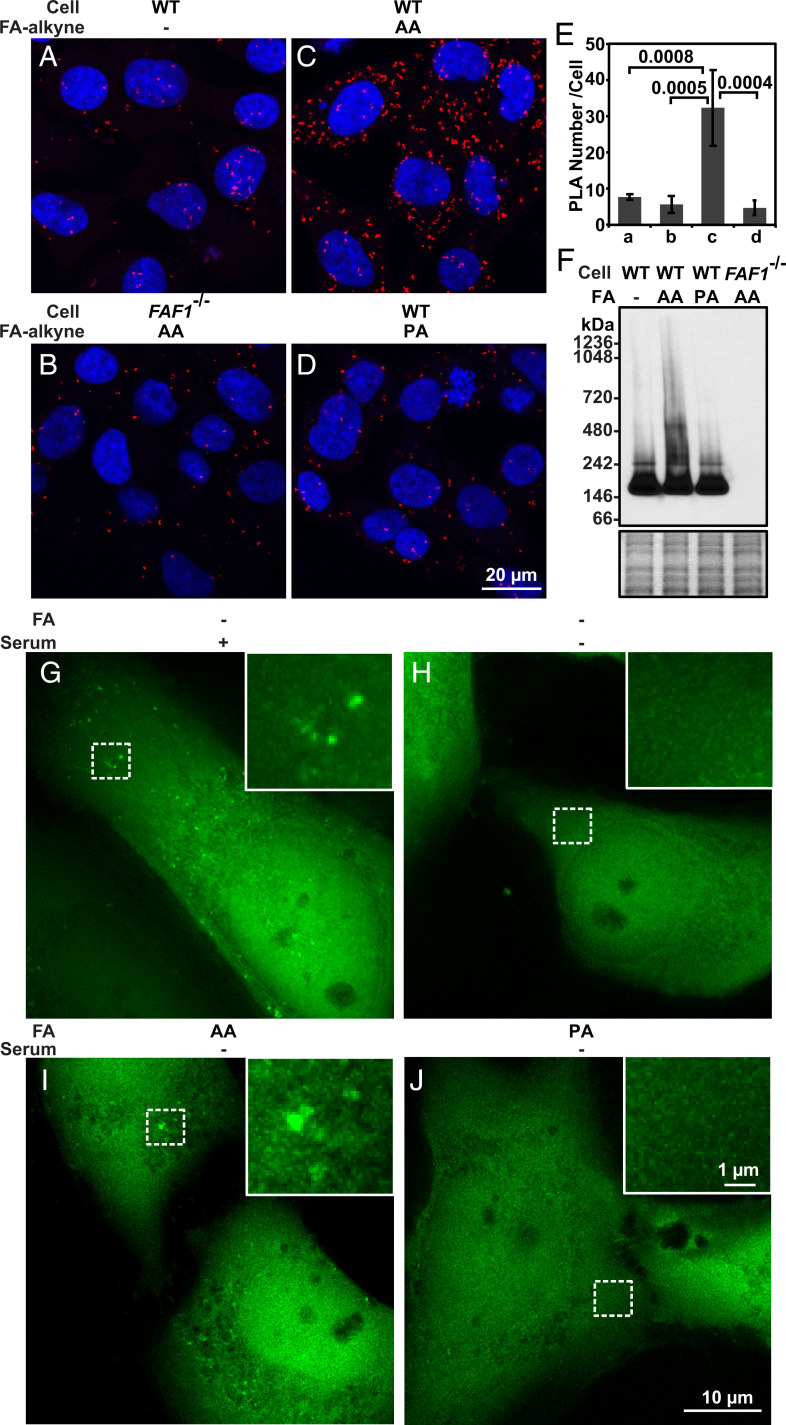
Fig. 5.
Assembly of FAF1–AA complex in cultured cells. (A–D) PLA interaction signal (red puncta) of SV589-derived cells subjected to indicated treatments. (E) PLA signal per cell reported as mean ± SD from 63 to 95 cells in experiments shown in A–D. (F) Immunoblot analysis of FAF1 following BN-PAGE in the indicated cells treated with the indicated FAs as described in Materials and Methods (Upper gel). InstantBlue-stained SDS-PAGE of the same samples serves as a loading control (Lower gel). (G–J) Live cell imaging analysis of FAF1−/−; pEGFP-FAF1 cells before (G) and after serum withdrawal with supplementation of the indicated FAs (H–J) as described in Materials and Methods.

