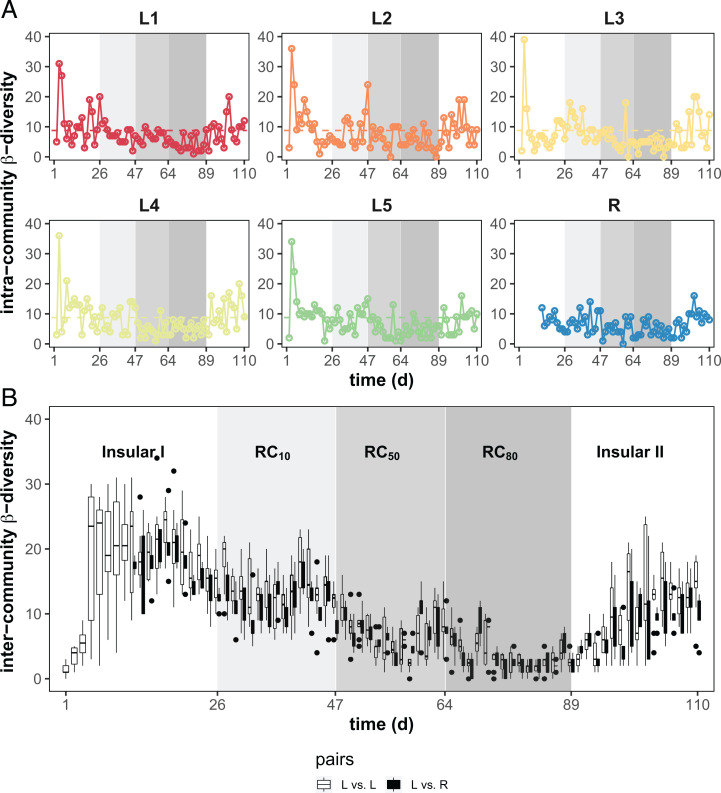
Fig. 3.
Intra- and intercommunity β-diversity characteristics of local microbiomes L1–L5 and the regional pool R. (A) Variation of intracommunity β-diversity over time. The number of unique dominant SCs was determined in pairwise successive samples within a microbiome. The threshold value was 8.76 and used to distinguish drift events from intrinsic cellular fluctuations during balanced growth condition (horizontal dashed line). The intracommunity β-diversity values were reduced and showed fewer drift events under RC50 and RC80 conditions compared with other phases. (B) Variation of intercommunity β-diversity over time. Numbers of SCs were determined that were not shared in pairwise samples at the same time point between local microbiomes L vs. L (open symbols) and L vs. R (closed symbols). An increase in recycling rates lowered intercommunity β-diversity to a high degree. The shaded areas represent different phases with changes in .

