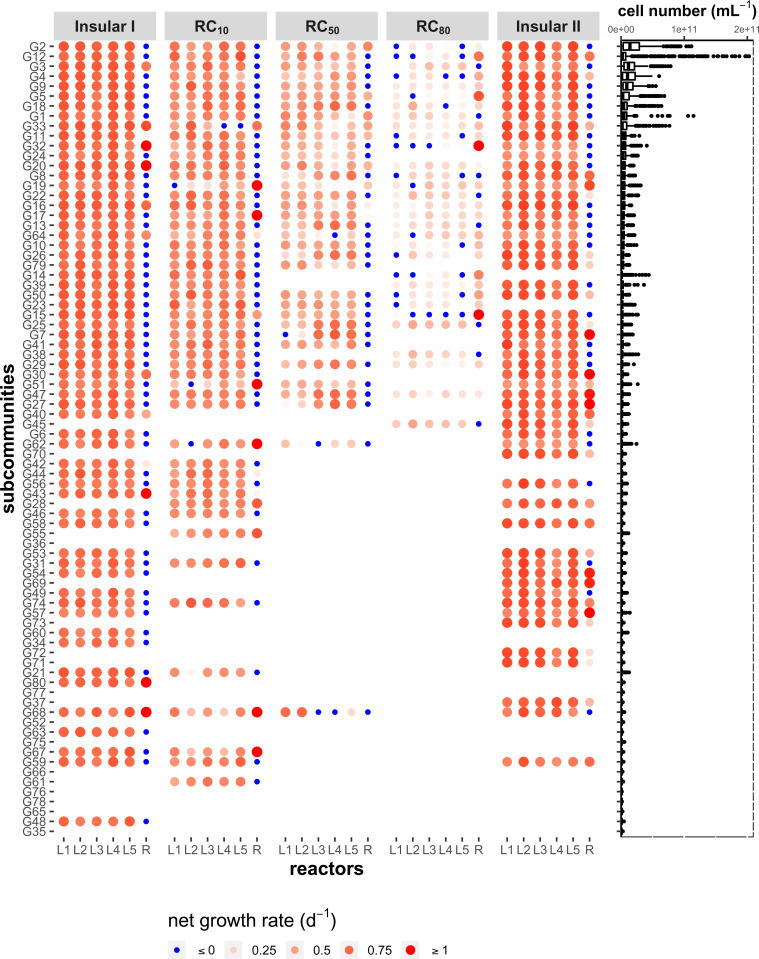
Fig. 4.
Cell numbers of SCs and net growth rates (x 1 to 80), determined for the balanced periods of the different phases in the local communities L1–L5 and the regional pool (R). On the left, the net growth rate (day−1) is presented only for dominant SCs with relative abundances 1.25% in at least one sample during the corresponding periods in L1–L5 and R. The color gradient and size of the red circles represent the value of positive . Darker colors and larger circles indicate higher values for positive net growth. All blue circles represent zero net growth The SCs are ranked in descending order according to their mean cell number (cells per milliliter) for all days and all reactors. Cell numbers of x 80 SCs of a total of 421 samples are shown as a boxplot on the right. Outliers of deviated cell number values are shown as points.

