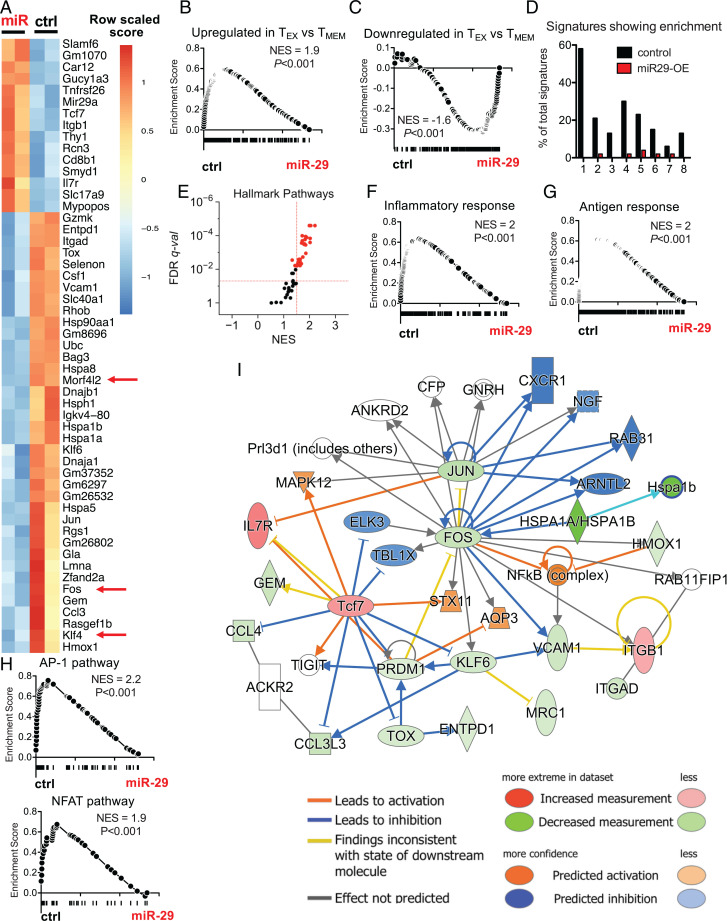
Fig. 3.
miR-29a instructs a memory-like CD8 T cell transcriptional profile during chronic infection. P14 cells were transduced with miR-29a OE (miR) or control empty (ctrl) RV and adoptively transferred as described in Fig. 2A. At d30 p.i., VEX+ P14 cells were sorted and RNA-seq was performed. (A) Heat map shows DE transcripts with FDR < 0.05. Red arrows highlight predicted targets of miR-29a. (B and C) GSEA was performed for gene signatures obtained from MSigDB (data set: GSEA 9650). (D) The percentage of pathways from each MSigDB database enriched (with FDR < 0.05) in ctrl (black) or miR-29a–OE cells (red). Databases are numbered as follows on the x-axis: 1: Hallmark; 2: Kyoto Encyclopedia of Genes and Genomes; 3: BioCarta; 4: Gene Ontology (GO) Molecular Process; 5: GO Cellular Component; 6: GO Molecular Function; 7: Gene Transcription Regulation Database; 8: miR predicted targets. (E) Hallmark pathways enriched in ctrl versus miR-29a–OE P14 CD8 T cells. (F–H) GSEA plots for the following data sets: (F) Inflammatory response (Hallmark); (G) antigen response (Goldrath); (H) AP-1 (PID) and NFAT (PID). (I) Network analysis for genes DE between miR-29a OE and ctrl with FDR < 0.05. NES, normalized enrichment score; q-val, q value.

