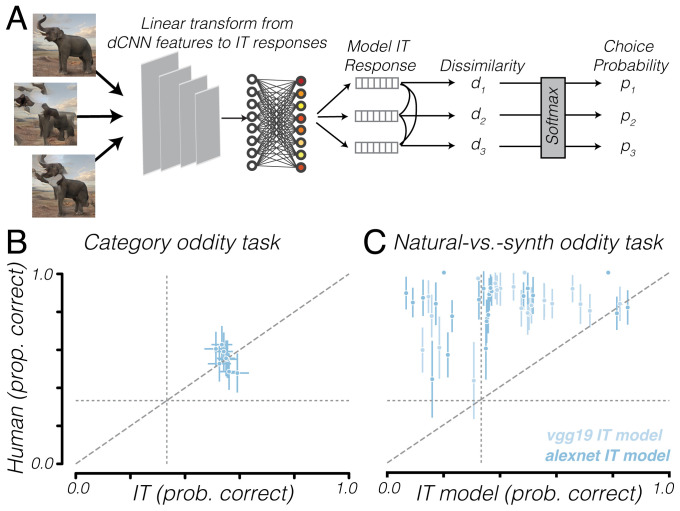
Fig. 5.
IT observer model matches human performance at category discrimination but not natural-vs.-synth discrimination. (A) Schematic of IT observer model which uses 168 macaque IT multiunit responses to images as feature vectors and computes dissimilarity and choice probability similarly to the observer model in Fig. 1B. For the category oddity task, we examined responses measured from macaque IT cortex (71), whereas, for the natural–synth task, responses were simulated using a dCNN linearly fit to the dataset. (B) IT observer model vs. human performance on category oddity detection task, category by category. (C) IT observer model vs. human performance on natural–synth discrimination task, image by image. Diagonal dashed line is line of equality. Vertical and horizontal dotted lines represent chance level. Error bars indicate bootstrapped 95% CIs across trials. prob., probability; prop., proportion.

