
FIGURE 4.
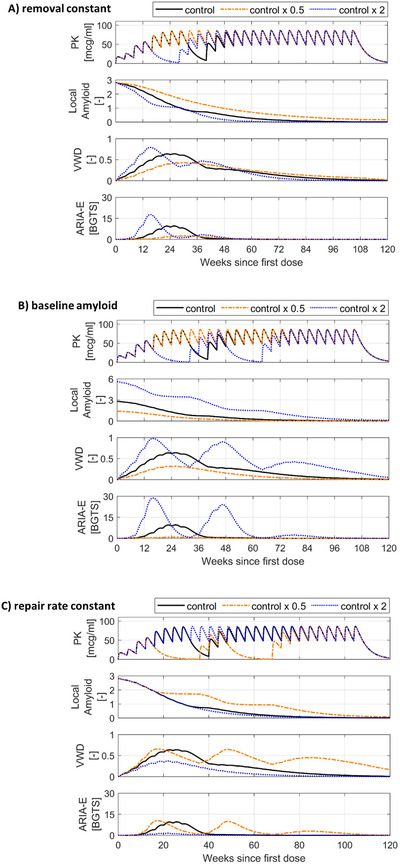
Exploring the effect of model parameters on amyloid‐related imaging abnormalities with edema/effusion (ARIA‐E) dynamics. In each set of simulations, only one key parameter is varied by doubling and halving the original control value, while all the other model parameters remain unchanged. The “control” temporal profiles shown in black are simulated using the model parameters estimated for ARIA‐E case 1, the dosing regimen 4 shown in Table S1, and a set of simple rules for MRI monitoring and treatment interruption; these rules are created for illustrative purposes and are described in supporting information. BGTS, Barkhof's Grand Total Scale; MRI, magnetic resonance imaging; PK, pharmacokinetics; VWD, vascular wall disturbance. Simulated ARIA‐E dynamics for: A) different removal constants, B) different baseline levels of local amyloid and C) different vascular repair rate constants