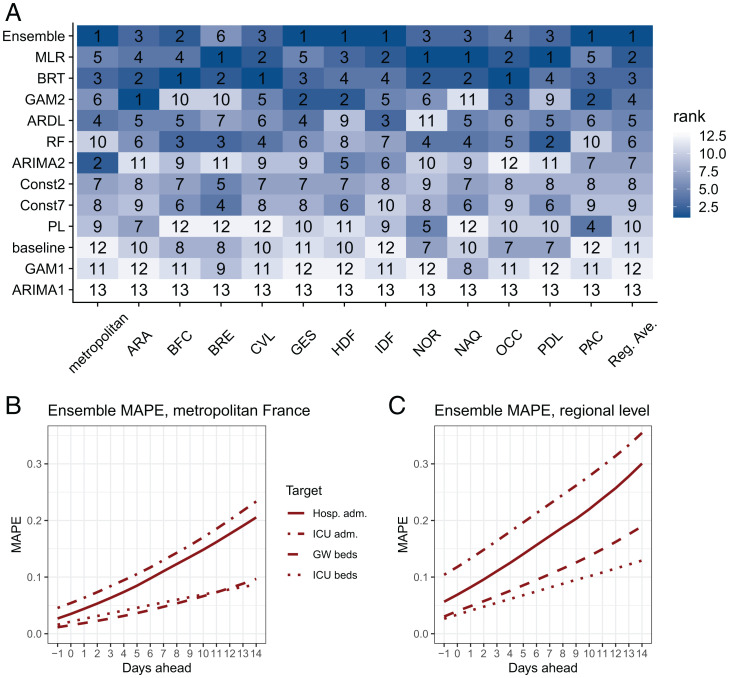
Fig. 4.
Model ranking by region and performance of the ensemble model for the four targets (hospital admissions, ICU admissions, general ward [GW] bed occupancy, and ICU bed occupancy) over the test period. (A) Ranks of the models. Models are ranked according to the RMSE over all prediction horizons. Reg. Ave. = regional average (RMSE computed over all regions except metropolitan France). (B) MAPE of the ensemble model by prediction horizon in metropolitan France. (C) MAPE of the ensemble model by prediction horizon at the regional level.

