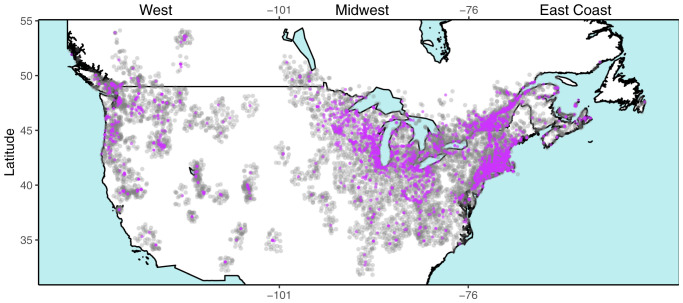
Fig. 2.
Map of the United States and Canada showing locations of 3,429 Lythrum salicaria specimens (purple dots) collected between 1866 and 2016 and locations of 6,303 weather stations (light gray dots) used to interpolate local climate data. Specimens are classified into three geographical regions with different invasion histories: West (west of −101° longitude), Midwest (−76° to −101°), and East Coast (east of −76° longitude).

