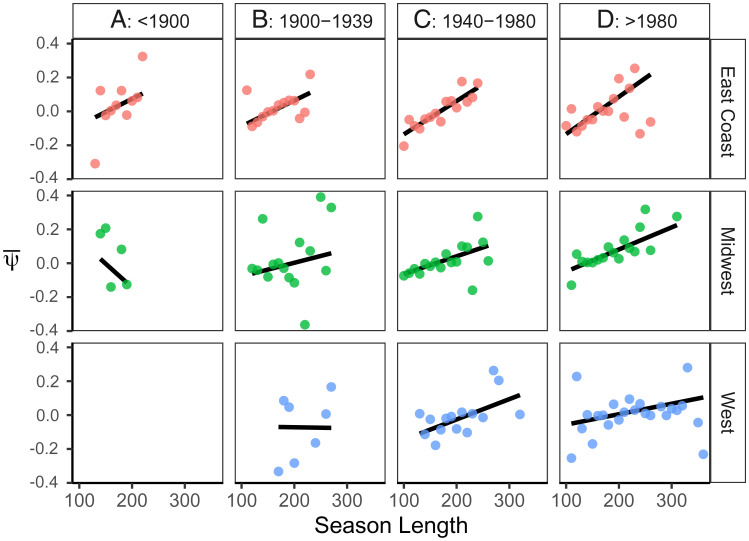
Fig. 4.
Spatial (rows) and temporal variation (columns) in phenological clines of Lythrum salicaria as it spread across North America. Clines in the (Top) East Coast (red dots), (Middle) Midwest (green dots), and (Bottom) West regions (blue dots) are divided by time of collection, binned into four eras (columns). Each bivariate plot shows the relationship between the mean phenological development time of herbarium specimens () and the mean estimated season length (SL), averaged across specimens binned every 10 d of SL.

