Fig. 1.
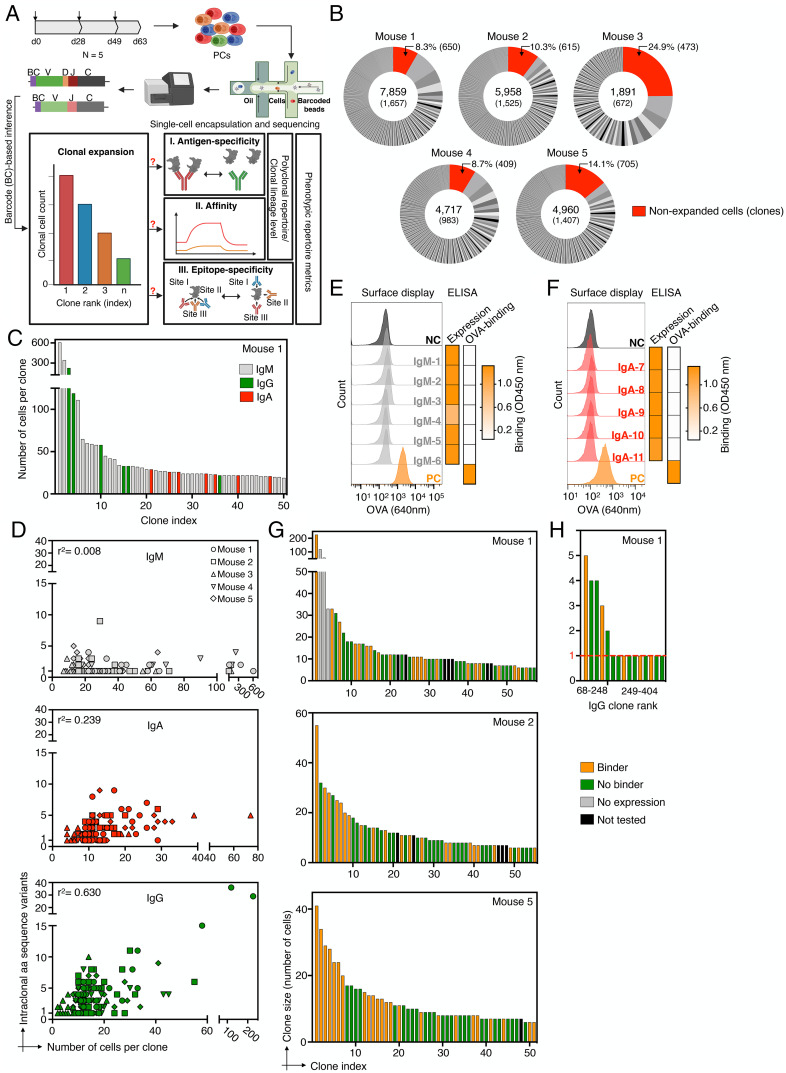
The antigen specificity of clonally expanded plasma cell antibody repertoires. (A) Schematic project outline. Arrows on top of the timeline graph (top left) indicate time points of mouse immunization. (B) Pie charts indicate the fraction of productive plasma cells (PCs) per clone and mouse captured by single-cell sequencing (sc-seq). Numbers in the center indicate the total number of productive cells (Top) and clones (Bottom). Unexpanded clones are shown in red and their cellular percentages and total numbers are indicated on top. Clone definition is based on an unique CDRH3-CDRL3 amino acid (aa) sequence. (C) Representative clonal expansion profile for the 50 most expanded clones of Mouse 1 (MS-1). Clones are colored by isotype majority and color-coded in gray (IgM), green (IgG), and red (IgA). Profiles of all mice are shown in SI Appendix, Fig. S5. (D) Correlation between the number of intraclonal antibody sequence variants (aa) and the number of cells per clone for the 30 most expanded clones per isotype. (E, F) Screening of six and five expanded IgM and IgA clones of MS-1 for antigen binding. Left: flow cytometry histogram plot shows ovalbumin (OVA) labeling of hybridoma cell lines with stable surface expression of selected antibody clones (from IgM or IgA PCs) or expression of positive or negative controls (antibodies with defined binding to OVA [PC, orange] or to hen egg lysozyme [NC, dark gray]). Right: heatmaps indicate antibody expression and binding to OVA based on endpoint ELISA (data obtained from SI Appendix, Figs. S7D and S8B). (G) Antigen-specificity profiling of the top 50–60 expanded clones of MS-1, MS-2, and MS-5. Clones with an endpoint ELISA signal >0.2 (threefold above background) are designated as antigen binders (SI Appendix, Fig. S9A). (H) Antigen specificity of clones showing lower to no clonal expansion (cell count = 1, red dotted line) from MS-1.

