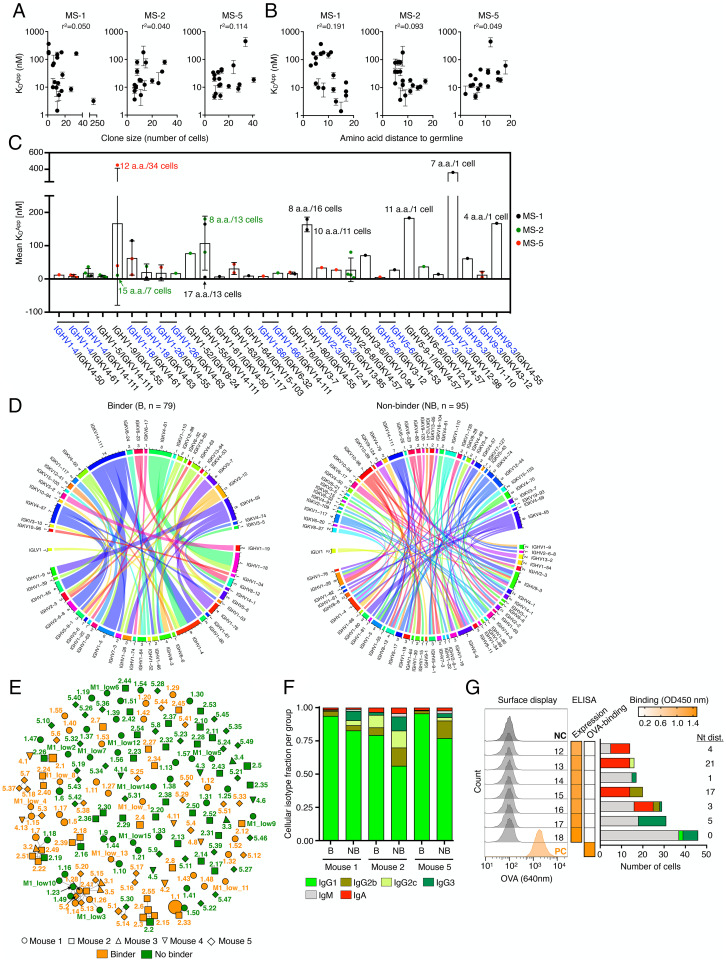
Fig. 2.
Genotype-phenotype correlations of polyclonal antigen-specific plasma cell repertoires. (A, B) Correlation between clonal apparent dissociation constant (Kd) and clone size (number of cells per clone, A) as well as clonal amino acid (aa) distance to germline (B) for MS-1, MS-2, and MS-5. Error bars indicate SD (n = 2–3 measurements of Kd). (C) Correlation between Kd and VH-VL germline V-gene usage. V-gene pairs featuring shared VH are indicated in blue with a shared horizontal bar on top. Some data points at the extremes are additionally labeled with the aa distance to germline and number of cells for their respective clones. Error bars indicate SD. (D) Circos plots show the diversity of VH-VL-gene pairings in the antigen-binding and nonbinding group of clones. Each line indicates the germline V-gene usage for an individual VH-VL gene pair. The inner track number and the corresponding thickness of the bar indicate the number of clones utilizing a given germline gene. Color corresponds to the respective germline gene. (E) Similarity network plot for all 174 antigen-binders and nonbinders tested across all mice. Edges represent clones separated by edit distance of <4 aa in CDRH3-CDRL3 sequences. Extent of clonal expansion is reflected by the size of the nodes. Annotated labels of each node are according to clone ID in SI Appendix, Tables S1 and S2. (F) Cellular isotype fractions for all binders (B) and nonbinders (NB) per mouse. Increased IgG1 (P adjusted = 0.017) was detected in the binder relative to the nonbinder groups as calculated by ANOVA using Sidak multiple comparison test. (G) Validation of multi-isotype clones by hybridoma surface staining and ELISA screening. Left and Middle: flow cytometry histograms and heatmaps similar to as shown in Fig. 1 E and F (ELISA data shown in SI Appendix, Fig. S14). Right: cellular isotype composition of each clone and associated nt distance from germline.

