Fig. 3.
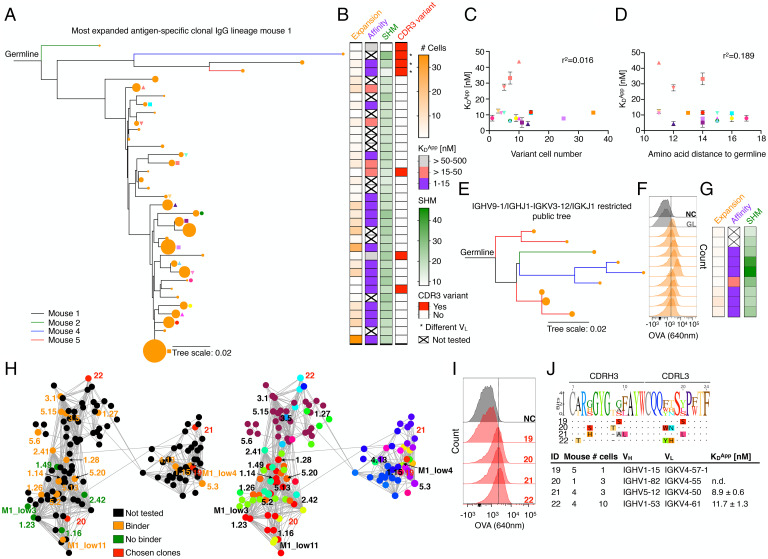
Phenotypic antibody profiling within plasma cell clonal lineages. (A) Phylogenetic lineage tree of the most expanded IgG clone of MS-1 (SI Appendix, Fig. S15). Related clones from different mice are indicated by different colors. The size of the orange nodes at the tip of each branch indicates the number of cells per intraclonal variant. Shapes indicate identity of intraclonal variants plotted in (C) and (D). (B) Left to Right: heatmaps correspond to intraclonal variant expansion (number of cells per variant), binding affinity (Kd), somatic hypermutations (SHM; nucleotide distance to germline), and CDR3 variants (1–6 aa edit distance in CDRH3-CDRL3). Clones featuring a different VL are marked by an asterisk. Intraclonal variants from top to bottom correspond to lineage tree variants, as shown in (A). (C) Correlation between apparent dissociation constant (Kd) and intraclonal variant cell number for all variants indicated in (A). Error bars indicate SD (n = 3–5 measurements of Kd). (D) Correlation between Kd and amino acid distance to germline. Error bars indicate SD (n = 3–5 measurements of Kd). (E) Phylogenetic lineage tree of clones originating from several mice that have similar sequences (identical V- and J-genes, CDRH3-CDRL3 with <5 aa difference) (SI Appendix, Fig. S17 A–C). Branch colors reflect mouse ID from (A) and node sizes reflect clone size. (F) Flow cytometry histograms for OVA binding, similar to Figs. 1E and 2F. GL denotes germline, clones correspond to lineage tree shown in (E). (G) Heatmap shown is similar to Fig. 3B. (H) Network plots of connected IgG sequence nodes from all mice harboring various VH-VL gene combinations. Edges represent clones separated by edit distance of three or less aa based on the concatenated CDR3 sequences. Left: verified binders, nonbinders, not tested clones as well as newly chosen clones are shown. Clone ID according to SI Appendix, Tables S1 and S2. Right: VH-VL gene usage visualization. Color code according to SI Appendix, Fig. S18C. (I) Flow cytometry histograms for OVA binding, similar to Figs. 1E, 2F, and 3F. (J) Concatenated CDRH3-CDRL3 aa sequence logos for clones selected in (H) (red nodes) as well as their antibody characteristics.

