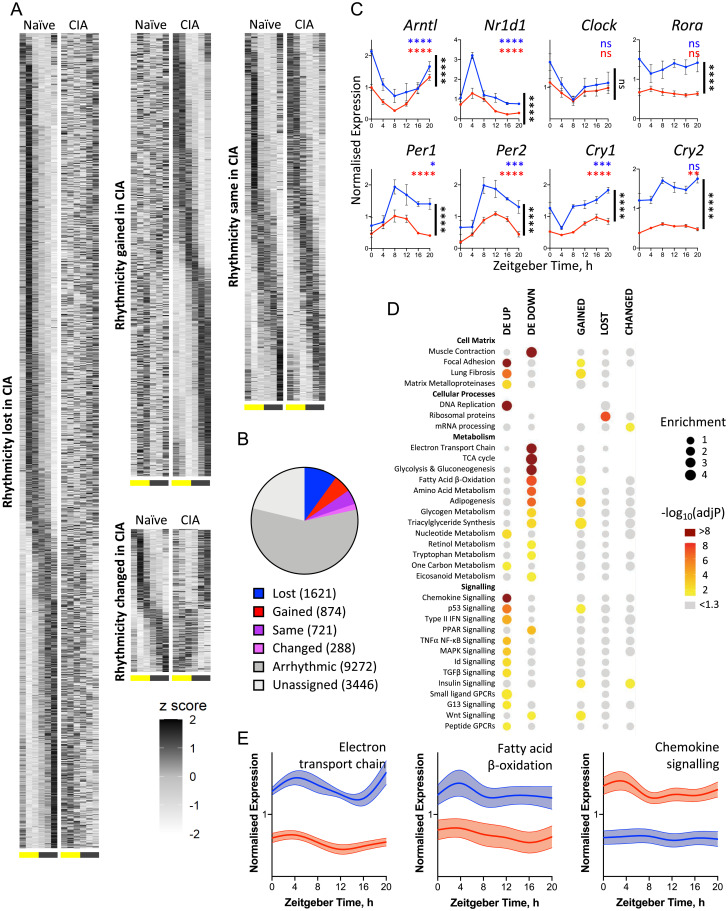
Fig. 2.
Inflamed joint tissue shows extensive changes in circadian transcriptional regulation. (A and B) Joint samples from naïve and CIA mice were collected on symptomatic day 7 at six time points and analyzed by RNA sequencing (n = 5/time point per condition). Heat maps (A) represent the normalized (z-scored) transcript expression levels in naïve (Left) and CIA (Right) mice over time (columns, from ZT0 at 4-h intervals). Differential rhythmicity analysis categorized transcript expression profiles according to change or maintenance of rhythmicity with disease (B). (C) CIA significantly altered the transcript expression of a number of core clock genes (CIA vs. naïve comparison by two-way ANOVA indicated in black; adjusted P [adjP] value of JTK analysis indicated in blue and red; n = 5/point. *P < 0.05, **P < 0.01, ***P < 0.001, ****P < 0.0001. Data are presented as mean ± SEM). (D) Groups of genes showing significant differential expression (DE) or rhythmic change with disease were analyzed for functional enrichment using the Enrichr tool (Materials and Methods) to identify altered gene expression across metabolic and signaling pathways (spot size represents fold enrichment of genes in group vs. the genome; color represents significance of enrichment; spot absence means no genes from the pathway were allocated to the group on statistical categorization). (E) Spline graphs show the mean normalized expression of all genes in selected WikiPathways gene sets (WP295, WP1269, and WP2292; error bars represent 95% CIs around the mean), demonstrating altered pathway expression in CIA mice. GPCR, G-protein-coupled receptor; ns, not significant.

